
Figures & data
Table 1. Baseline characteristics of study population.
Figure 1. Flow diagram summarizing the process of enrollment.
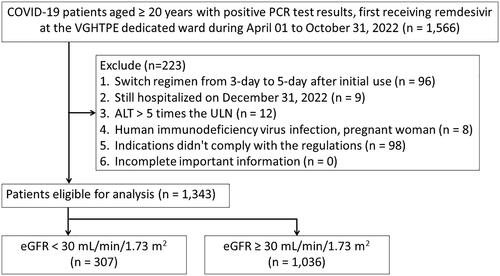
Figure 2. Kaplan-Meier survival curves of the COVID-19 cohort receiving remdesivir (A) acute kidney injury (B) bradycardia (C) mortality in COVID-19 dedicated ward (D) Mortality in hospital.
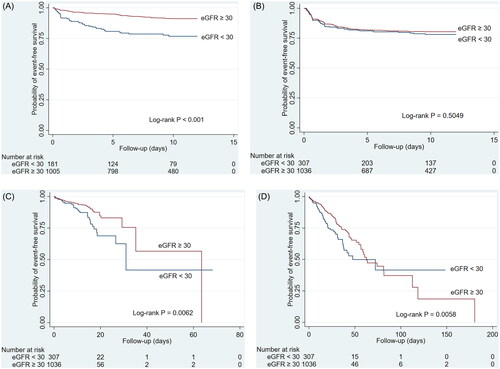
Table 2. Incidence rates and hazard ratios for primary outcomes.
Table 3. Secondary outcomes.
Supplemental material
Supplemental Material
Download MS Word (34.1 KB)Data availability statement
The datasets created and examined in the present study cannot be accessed by the public due to the regulations of the Institutional Review Board at Taipei Veterans General Hospital. The dataset can be obtained from the corresponding author or IRB of TVGH upon request (email: [email protected]). Data can only be utilized for research purposes.