
Figures & data
Figure 1. The flowchart of patient enrolled in this study.
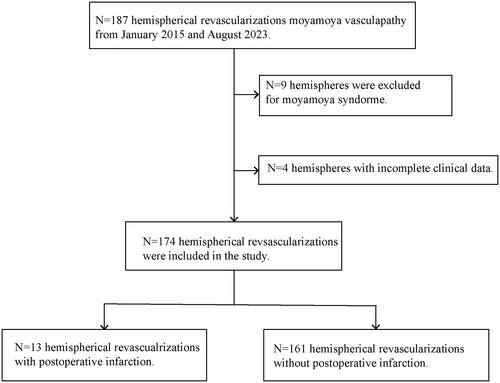
Figure 2. A 62-year-old male with MMD who underwent left revascularization, MRI test showed infarction in the left corona radiata and basal ganglia, accompanied by local liquefaction (A: T1 sequence, B: T2 sequence, C: flair sequence, D: diffusion weighted imaging sequence). MMD: moyamoya disease; MRI: magnetic resonance imaging.
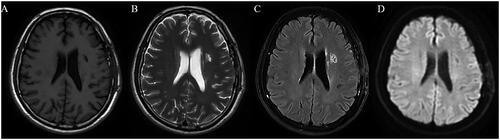
Table 1. Demographic and clinical characteristics of the 108 patients.
Table 2. Univariate analysis of patients with or without new or expanded infarction.
Table 3. Multivariate analyses for independent risk factors of new or expanded cerebral infarction.
Figure 3. ROC curves depicted the AUC of predictive equation. (A) ROC curves for Suzuki stage on the non-operative side, PCA involvement, and intraoperative hypotension. (B) The ROC curves for the predictive equation with combination of all the three factors. ROC: receiver operating characteristic; AUC: area under the ROC curve; PCA: posterior cerebral artery.
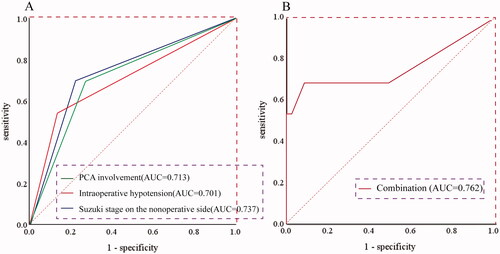
Table 4. Evaluation efficiency for the risk factors by ROC.
Table 5. Comparison of characteristics between patients with or without PCA involvement.
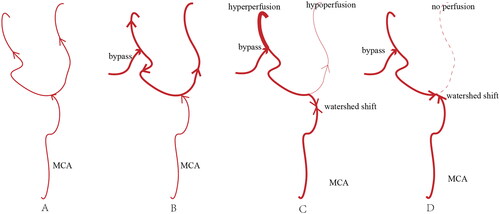
Figure 4. The figure illustrated the mechanism of infarction remotely located from the anastomosis site in patients with MMD after revascularization. (A) The branch of MCA and their distal perfusion in patients with moyamoya disease. (B) The ideal hemodynamic condition after revascularization, which was, however, challenging to achieve. (C) and (D) The watershed shift after bypass, where (C) depicted the watershed shift proximally at the bifurcation, with partial perfusion still present in the remote site, while (D) showed the watershed shift at the bifurcation, with minimal and even no perfusion in the remote site. MMD: moyamoya disease; MCA: middle cerebral artery.
Data availability statement
All data are available without restriction by contacting Tao Sun or Hui Wang.