
Figures & data
Table 1. Baseline characteristics of the study cohort according to oral anticoagulant categories.
Figure 1. Crude cumulative incidence curves of (a) ischaemic stroke, (b) intracranial haemorrhage and (c) all-cause mortality in the studied oral anticoagulation groups. TTR: time-in-therapeutic-range.
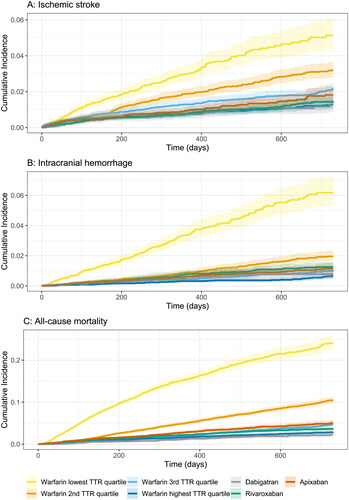
Figure 2. Inverse-probability-of-treatment-weighted Cox hazard ratios of calculated incidence rates per 100 patient years for direct oral anticoagulants compared with warfarin in different time-in-therapeutic-range groups for ischaemic stroke, intracranial haemorrhage, any bleeding and death endpoints. Reference group (1) = warfarin patients with the second best (TTR group 3) time-in-therapeutic-range (TTR).
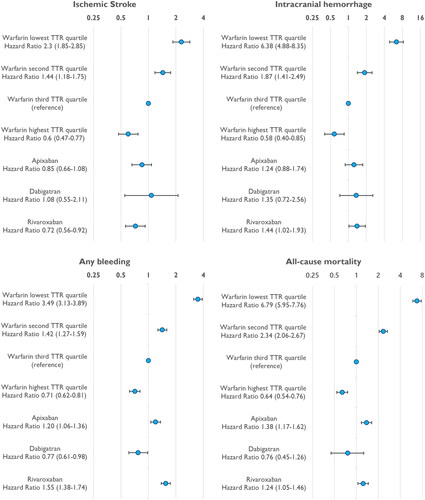
Table 2. Crude and weighted rates of outcome events according to the treatment categories.
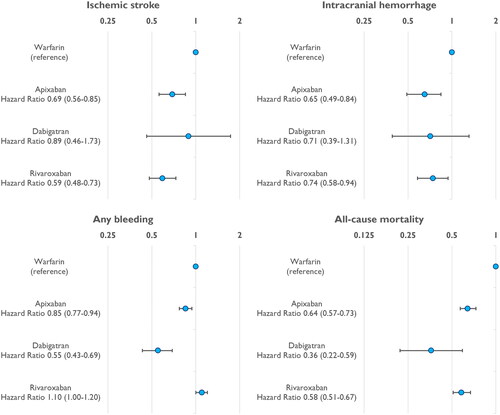
Figure 3. Inverse probability of treatment weighted Cox hazard ratios of calculated incidence rates per 100 patient years for direct oral anticoagulants compared with warfarin for ischaemic stroke, intracranial haemorrhage, any bleeding and death endpoints. Reference group (1) = warfarin.
Supplemental Material
Download Zip (438.1 KB)Data availability statement
The data underlying this article were provided by the Finnish Institute for Health and Welfare (THL), the Population Register Center and the Social Insurance Institution (KELA) under license. Based on the contracts with the Finnish registries, restrictions apply to the availability of these data, and so they are not publicly available. Data might be, however, available from the authors upon reasonable request and with permissions needed from the Finnish Institute for Health and Welfare (THL), the Population Register Center and the Social Insurance Institution (KELA).