
Figures & data
Figure 1. Venn diagram representing the public source of knowledge about CKD Venn shape showed the different sources of knowledge about CKD. The numbers represent the participants who chose one or more source of knowledge. TV, Books, Social media and internet, and healthcare professionals. Among the 2181 participants, 1207 identified their source of knowledge.
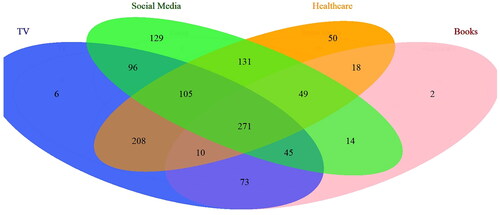
Table 1. Baseline sociodemographic, health information and CKD knowledge score.
Table 2. The public knowledge about kidney functions, chronic kidney diseases etiology, symptoms and treatments.
Table 3. The public source of knowledge about CKD.
Table 4. Multiple regression analysis of public knowledge score and the participants’ baseline characteristics.
Data availability statement
The data are available by the corresponding author upon request.