
Figures & data
Figure 1. Body compositions and left ventricular diastolic function in Cushing’s syndrome and control group. Markedly increased epicardial fat volume (A) and visceral fat area (B) were observed, along with decreased skeletal muscle area (C) and skeletal muscle index (D) in CS patients. In terms of left ventricular diastolic function, CS patients exhibited a lower E/A ratio (E) and a higher prevalence of LVDD (F). CS Cushing’s syndrome, EATV epicardial adipose tissue volume, VFA visceral fat area, SMA skeletal muscle area, SMI skeletal muscle index, LVDD left ventricular diastolic dysfunction. ***P less than 0.001.
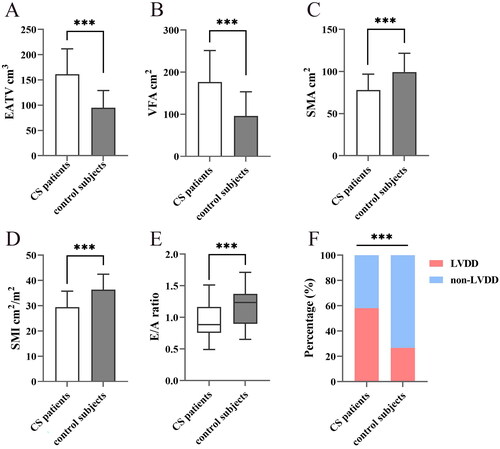
Table 1. Characteristics of Cushing’s syndrome patients and control subjects.
Table 2. Comparisons of characteristics between Cushing’s syndrome subjects with or without left ventricular diastolic dysfunction.
Figure 2. Correlation analysis of body compositions, biochemical indicators and E/A ratio. A negative correlation was found between the E/A ratio and EATV and VFA. There was no correlation between SMA, SMI, and the E/A ratio. HDL-C and eGFR were positively correlated with the E/A ratio. EATV epicardial adipose tissue volume, VFA visceral fat area, SMA skeletal muscle area, SMI skeletal muscle index, HDL-C high-density lipoprotein cholesterol, eGFR estimated glomerular filtration rate.
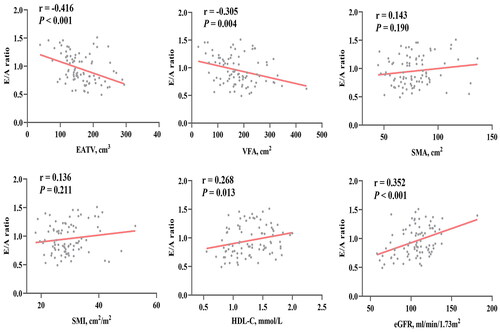
Table 3. Potential factors associated with E/A ratio in Cushing’s syndrome subjects in multiple regression analysis.
Figure 3. Comparative analysis of epicardial adipose tissue volume in Cushing’s syndrome subjects with and without left ventricular diastolic dysfunction and ROC curve analysis. A. Significantly increased EATV in CS patients with LVDD. B. ROC analysis revealed a significant correlation between EATV and LVDD (AUC 0.698, 95%CI 0.581–0.814, p = 0.002). CS Cushing’s syndrome, EATV epicardial adipose tissue volume, LVDD left ventricular diastolic dysfunction, ROC receiver operating characteristic. **P less than 0.01.
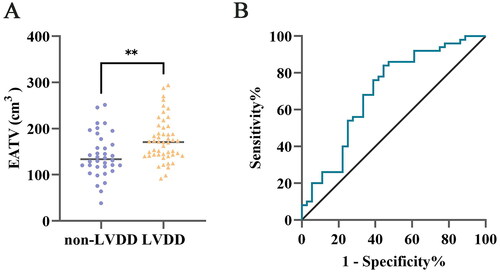
Table 4. Univariate and multivariate logistic regression analysis for the association of left ventricular diastolic dysfunction with various factors in Cushing’s syndrome subjects.
Supplemental Material
Download MS Word (347.6 KB)Data availability statement
All data produced or analyzed during this study are incorporated in this article or displayed in supplementary material.