Figures & data
Figure 1 The relationship between body mass index (BMI) and whole body insulin sensitivity, measured using the euglycemic clamp technique, in 1,394 healthy non‐diabetic European men and women whose data have been included in the European Group for Insulin resistance (EGIR) database. The arrow depicts the range of variation in whole body insulin sensitivity at a BMI of 28 kg/m2. Data used by permission from the EGIR.
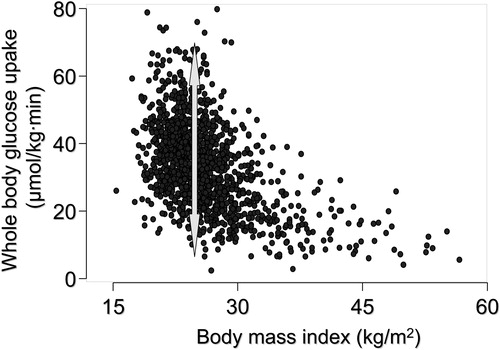
Figure 2 An example of a lipoatrophic mouse model Citation11. These mice (mouse on the left in the panel on the left) are unable to store fat subcutaneously but store excessive amounts of fat in the liver. The liver becomes severely insulin resistant. Transplantation of normal adipose tissue subcutaneously (mouse on the right in the panel on the left) removes excess fat and normalizes insulin sensitivity in the liver. Reproduced with permission from Citation11.
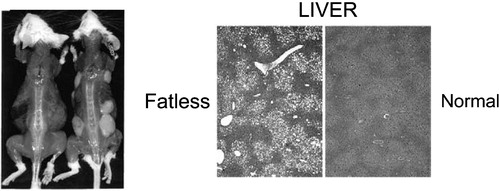
Figure 3 The relationship between the amount of subcutaneous fat measured with magnetic resonance imaging and percent liver fat (LFAT, panel on the left) and fasting serum insulin (fS‐insulin, panel on the right) in 132 non‐diabetic healthy men and women. Reproduced with permission from Citation4.
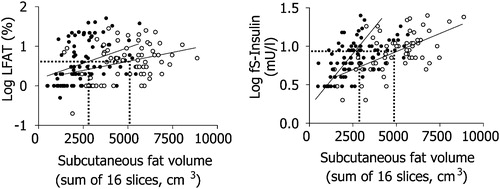
Figure 4 The relationship between the amount of liver fat and fasting serum insulin (fS‐insulin, panel on the left) and between intra‐abdominal fat and serum fasting insulin (panel on the right) in 132 non‐diabetic healthy men and women. Reproduced with permission from Citation4.
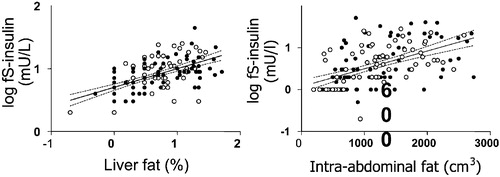
Figure 5 The relationship between liver fat measured with magnetic resonance spectroscopy and serum alanine aminotransferase activity (S‐ALT) in 132 non‐diabetic healthy men and women. Reproduced with permission from Citation4.
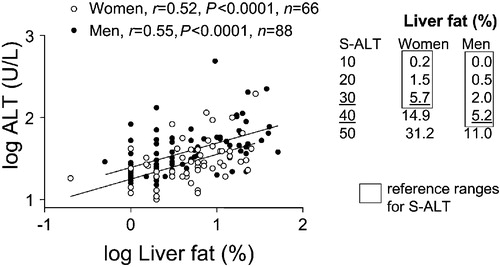
Figure 6 Causes of elevated liver function tests (serum alanine or aspartate aminotransferase above the upper limit of normal) according to the Third National Health and Nutrition Examination Survey (1988–94) including 15,676 adults aged 17 years and over in the United States. NAFLD = non‐alcoholic fatty liver disease. Reproduced with permission from Citation28.
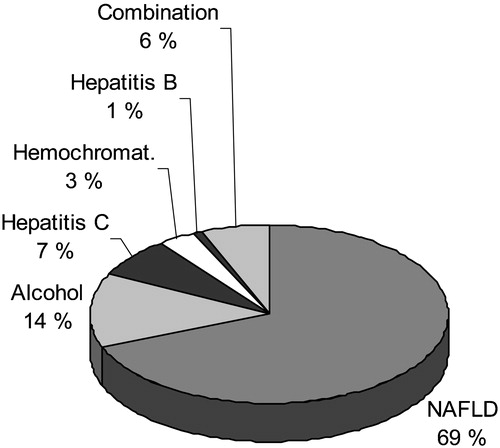
Figure 7 Effects of 4 months of rosiglitazone or metformin treatment on percent liver fat (upper panel) and serum adiponectin concentrations (lower panel) in type 2 diabetic patients. Reproduced with permission from Citation37.
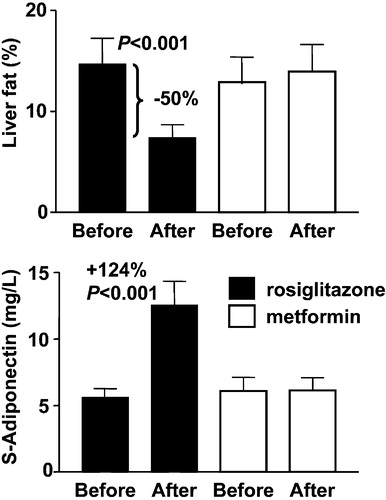
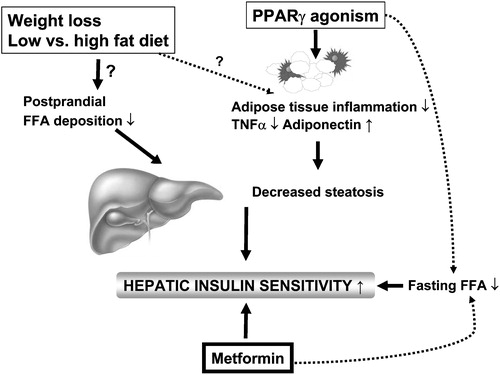
Figure 8 Regulators of liver fat content in humans. Liver fat content can be decreased by weight loss, and by lowering of dietary fat content and PPARγ agonism. While the exact mechanisms underlying the beneficial effects of weight loss and dietary fat content on liver fat are uncertain, at least one of the mechanisms via which PPARγ agonists could reduce hepatic fat content is by increasing adiponectin expression in adipose tissue. Metformin appears to increase hepatic insulin sensitivity without changing liver fat content.