Figures & data
Table I. Characteristics of the patients at baseline.
Figure 1. Frequency distribution of plasma eicosapentaenoic acid(EPA) and docosahexaenoic acid (DHA) after 24 months of treatment.
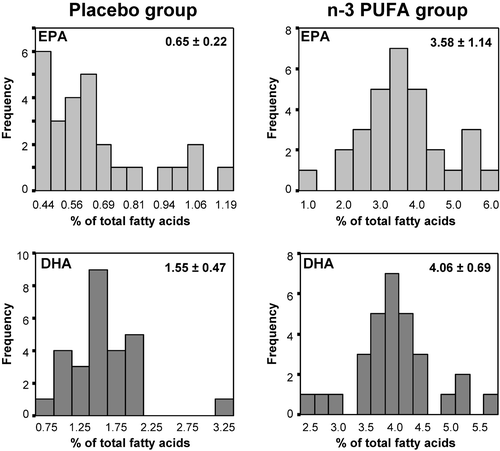
Figure 2. Effects of n‐3 polyunsaturated fatty acids (n‐3 PUFA) on platelet aggregation (Panel A) and platelet thromboxane B2 synthesis (Panel B). Data are expressed as changes with respect to baseline. (*Pwithin<0.01; #Pbetween<0.05; ##Pbetween<0.01).
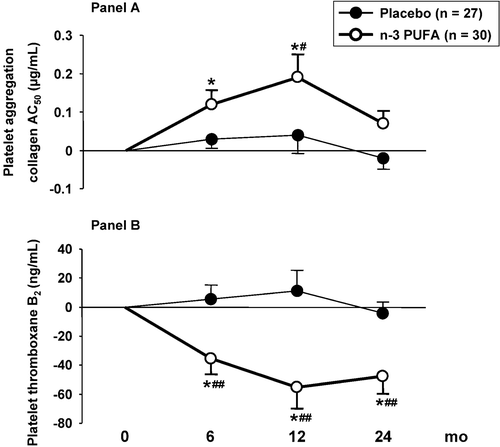
Table II. Intima‐media thickness (IMT) progression in n‐3 polyunsaturated fatty acids (n‐3 PUFA) and placebo groups.
Table III. Effect of n‐3 polyunsaturated fatty acids (n‐3 PUFA) on ultrasound video‐densitometry of right common carotid intima‐media thickness (CC‐IMT) segments.