Figures & data
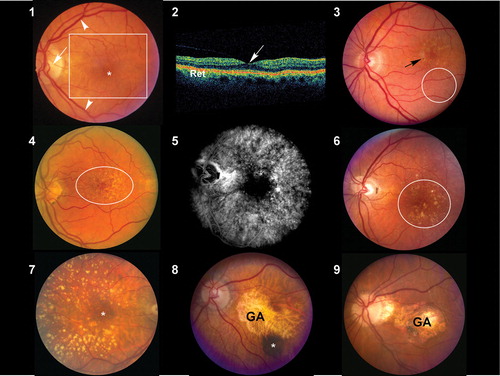
Figures 1–9. : Normal macula of an elderly patient. The asterisk represents the location of the fovea, which lies directly in the visual axis. The macula (boxed area), which is adapted for high acuity vision, is located temporal to the optic nerve (arrow). It is approximately 6 mm in diameter and centered on the fovea. The vascular arcades are indicated by arrowheads. : Ocular coherence tomogram (OCT) of a normal macula. The central area of depression (arrow) represents the fovea, corresponding to the asterisk depicted in . Ret = retina. : Color fundus photograph derived from an individual with early, dry age‐related macular degeneration (AMD). Retinal pigment epithelium (RPE) pigment disruption is present in the macula (arrow) and numerous small (<63 microns in diameter) hard drusen are present inferior to this region (oval). : Color fundus photograph from an individual with dry AMD. Numerous small and intermediate‐sized drusen are visible in the macular region (oval). and : Corresponding fluorescein angiogram () and color fundus photograph () images from an individual with dry AMD. Although larger and confluent drusen are visible in the color image (circle), the number and extent of drusen distribution is appreciated even more clearly in the angiogram. The hyperfluorescent drusen observed in the angiogram are of uniform size and often referred to as cuticular drusen. : Color fundus photograph from an individual with dry AMD, depicting the presence of numerous large (>125 micron diameter), calcified drusen deposited primarily within the peri‐ and parafoveal regions. Smaller drusen are present in the foveal region (asterisk). and : Color fundus photograph from two patients with macular geographic atrophy (GA). The margins of the regions of RPE atrophy are clearly delineated. Choroidal blood vessels are more easily visualized in these regions of atrophy because of the loss and/or absence of the RPE pigment. A choroidal nevus (asterisk) is indicated in . These eyes would be expected to have poor central vision due to the extensive atrophy.
Figures 10–18. Color fundus photograph(), early fluorescein angiogram () and late fluorescein angiogram () from an individual with a classic choroidal neovascularization (CNV). Subretinal blood and fluid (arrowhead depicts edge) is clearly visible within the macular region in . Note the lacey appearance of vessels (asterisk) in the early angiogram. Marked leakage of fluorescein (asterisk), with indistinct edges of hyperfluorescence (white area) is clearly visible in the late angiogram. Color fundus photograph (), early fluorescein angiogram () and late fluorescein angiogram () from an individual with occult choroidal neovascularization. A single, small punctate region of hemorrhage (black arrow) and a ring of exudates (arrowhead depicts edge) that appears more indolent than that which typically occurs in classic choroidal neovascularization (CNV) () is visible in . Note that there is minimal hyperfluorescence in the early phase of the angiogram, in contrast to that observed in the early stage of classic CNV. Speckled macular hyperfluorescence–‐in contrast to the profuse leakage of fluorescein that occurs in classic lesions–‐is visible in the late stage angiogram (). Corresponding angiographic () and ocular coherence tomogram (OCT) images () from an individual with a macular pigment epithelial detachment (PED). A multilobulated, hyperfluorescent lesion with sharply demarcated borders (arrow) is clearly visible in the late stage angiogram depicted in . The blister‐like elevation of the retina and retinal pigment epithelial layer, which correlates with the PED shown in , is appreciated on OCT in . SRF = subretinal fluid; RET = retina. : Color fundus photograph from an individual with end stage (cicatricial) exudative age‐related macular degeneration (AMD). A large disciform scar (arrowhead) covering the macular region is distinctly visible.
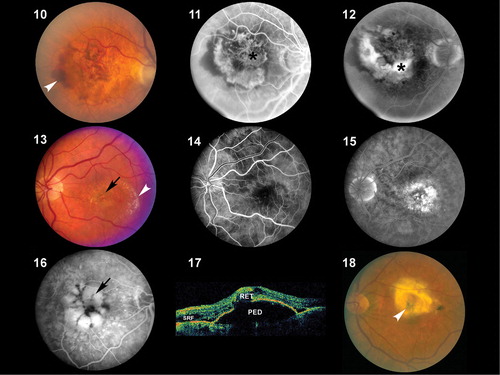
Figure 19. Goldmann visual field simulating an individual with central visual loss. The physiological blind spot, which corresponds to the location of the optic nerve head, is depicted as a small dark oval. The larger, more irregular darkened region corresponds to a blind spot, or scotoma, caused by atrophy and/or scarring within the macula.
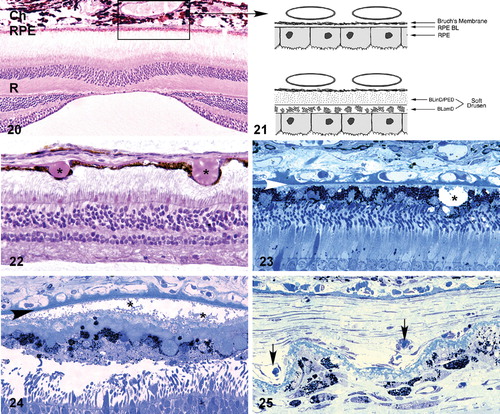
Figures 20–25. Light microscopic(, –) and schematic () images depicting the choroid‐RPE‐retina interface. A section showing the normal anatomical relationships of the macular choroid (Ch), retinal pigmented epithelium (RPE) and neural retina (R) is shown in ; the section passes directly through the foveal pit. The boxed region corresponds to that depicted in , which compares the choriocapillaris‐RPE interface in unaffected (top) and affected (bottom) individuals. The majority of early age‐related macular degeneration (AMD)‐associated extracellular lesions–‐including drusen, basal laminar deposit (BLamD), and basal linear deposits (BLinD)–‐form along this interface. Drusen (asterisks), which form between the RPE and Bruch's membrane, are present in and . Extensive accumulations of BLamD (asterisks), which form between the RPE and its basal lamina, are depicted in . Choroidal neovessels, located in both the sub‐RPE and subretinal spaces (arrows) are shown in . Arrowheads in and , Bruch's membrane.
Figures 26–29. Transmission electron micrographs of the retinal pigment epithelium(RPE)‐choroid interface in eyes of donors without () and with (–) a clinically documented history of age‐related macular degeneration (AMD). A single druse (D) is shown in ; its location between the RPE basal lamina (arrowheads) and Bruch's membrane (BM) is clearly indicated. BLamD (asterisk) accumulates between the basal surface of the RPE and its basal lamina (arrow), whereas BLinD is located within the innermost aspect of Bruch's membrane (). A patent choroidal neovessel (asterisk), lying between BM and a layer of BLamD (rectangle), is shown in . RPE = retinal pigment epithelium; BM = Bruch's membrane.