Figures & data
Table I. Clinical characteristics of diabetic patients and non‐diabetic control subjects. The data are expressed as means and standard deviation in parentheses, except for vitreous VEGF, which is presented as median and range.
Table II. Clinical characteristics of the diabetic subjects.
Figure 1 Vitreous VEGF concentration in diabetic patients with proliferative retinopathy according to statin use or ACE inhibitor use. The data are expressed as follows: black line inside the box indicating median; box between 25 and 75 percentiles; whiskers, 5 and 95 percentiles. ACE = angiotensin‐converting enzyme; VEGF = vascular endothelial growth factor.
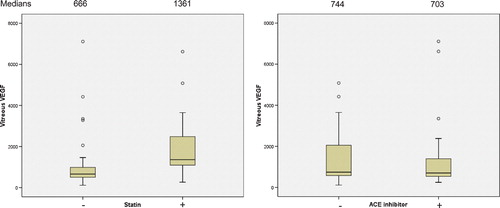
Table III. Diabetes duration, glycaemic control, blood pressure and vitreous VEGF, in non‐diabetic control subjects, diabetic patients without proliferative retinopathy, or in diabetic patients with proliferative retinopathy according to statin medication. The data are expressed as means and standard deviation for others, and vitreous VEGF as median and range. The n for vitreous VEGF is shown in parentheses. Statistical testing was done between diabetic groups with ANOVA, except for vitreous VEGF where Kruskal‐Wallis was used.
Table IV. Diabetes duration, glycaemic control, blood pressure and vitreous VEGF in diabetic patients with proliferative retinopathy in the four medication groups divided according to ACE inhibitor (A) or statin (S) medication: A‐/S‐, A+/S‐, A‐/S+ and A+/S+. The data are expressed as means and standard deviation for others, and vitreous VEGF as median and range. The n for vitreous VEGF is shown in parentheses.