Figures & data
Table I. Base‐line characteristics and plasma indices of angiogenesis in 251 patients with hypertension enrolled in ASCOT. Values are n (%), mean (SD), or *median (IQR = interquartile range).
Table II. Base‐line and 6‐year follow‐up of hypertensive patients: indices of risk management. Data are given as mean (SD).
Figure 1 Kaplan‐Meier cumulative event‐free survival charts between tertiles of plasma angiopoietin‐2 levels, in relation to cardiovascular outcomes. A: Composite cardiovascular outcomes; B: myocardial infarction; C: ischaemic cerebrovascular events.
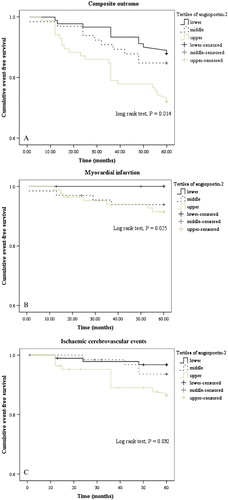
Table III. Area under the curve (AUC) analysis of angiopoietin‐2 and cardiovascular risk factors with incident vascular outcomes in 192 hypertension patients free of cardiovascular events at base‐line.
Table IV. Cox regression analysis of cardiovascular risk factors and raised plasma angiopoietin‐2 (>4.3 pg/mL) at base‐line with incident MI in hypertension patients.