Figures & data
Figure 1. Diagram adapted from Lee et al. Citation106 showing five complexes involved in oxidative phosphorylation. We found decreased expression in brain for key mitochondrial DNA-encoded transcripts in neuropsychiatric disorders as shown in .
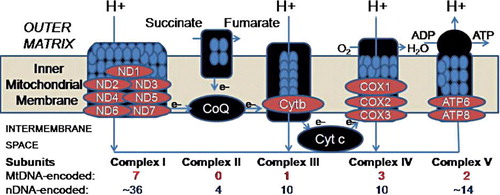
Table I. Demographics of four groups of subjects from which DLPFC was obtained. All subjects had a rapid death and absence of prolonged hypoxia prior to death.
Table II. Gene expression results of 13 mitochondrial genes and D-loop. The t test and ANCOVA values are shown.
Figure 2. The mitochondrial common deletion is increased in psychiatric disorders. The individual subjects are plotted by age and common deletion (x-axis ratio of 350/5000 bp). Subjects with BPD died at a younger age in this study; there was a significant increase in common deletion after age adjustment. The blue circle indicates the 95% confidence limits around the control subjects. The increase in the common deletion for nine psychiatric subjects is shown outside of the blue circle. Group abbreviations are shown in .
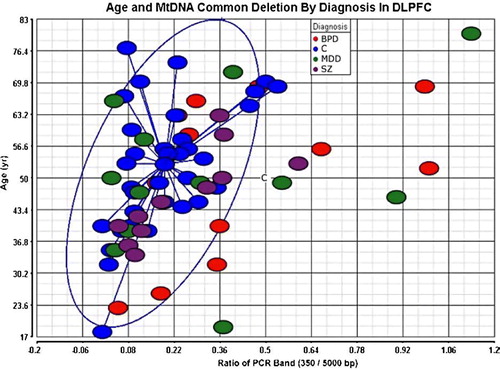
Figure 3. Genotyping for large common deletion. Subjects were genotyped in duplicate at two concentrations. Arrows indicate presence of deletion relative to 5000 bp upper non-deleted band. Group abbreviations are shown in .
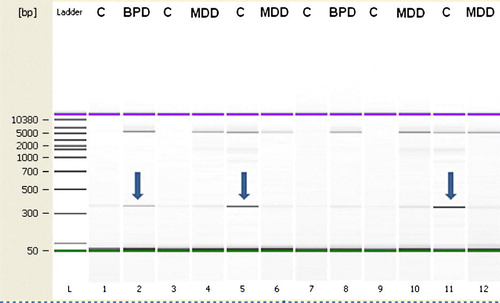
Table III. Mitochondrial common deletion (ratio of 350 bp/5000 bp) is increased in BPD. PCR amplification around the deleted fragment (350 bp) and the non-deleted fragment (5000 bp) was measured in the same PCR reaction and Agilent gel lane (see ). This assay was linear in the range of 10–20 ng of DNA (r=0.98), and duplicate values were averaged for each sample.