Figures & data
Table I. Comparison of differentiation in human embryonic stem cell lines.
Figure 1. Relative gene expression levels for Brachyury T (A), mesoderm posterior 1 (MESP1) (B), cardiac lineage marker NKX2.5 (C), Islet-1 (ISL-1) (D) in HS181, HS293, HS346, and HS368 on days 3 and 6.
Figure 2. A: Beating area in an END-2 co-culture plate from HS346. B: Beating cells are troponin T-positive; C: connexin-43 is located in the contact surfaces of beating cells. D: The merged picture of B and C with DAPI (4′,6 diamidino-2-phenylindole) staining. E: Beating cells are also sarcomeric α-actinin-positive. F: Some of the cells are proliferative as shown with Ki67 staining. G: The same cells stained with DAPI (4’,6 diamidino-2-phenylindole). H: The merged picture of E, F, and G. The scale-bar is 200 µm.
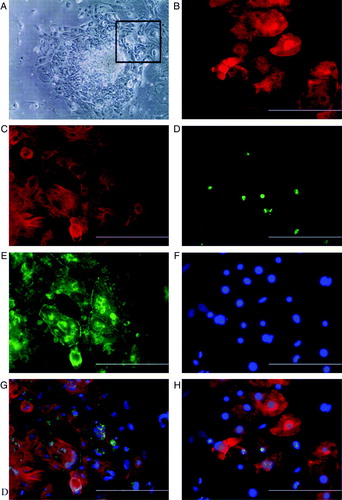
Figure 3. A: A Microelectrode array-recording recording of isoprenaline and esmolol effects. Signal a: no treatment, average beating rate (ABR) 24 beats/min; b: 0.017 µg/mL isoprenaline, ABR 36 beats/min; c: 0.017 µg/mL isoprenaline and 14.3 µg/mL esmolol, ABR 24 beats/min; and d: 0.017 µg/mL isoprenaline and 25.0 µg/mL esmolol, ABR 6 beats/min. With both 0.017 µg/mL isoprenaline and 25.0 µg/mL of esmolol in the medium, clear beating was observed at only one microelectrode, whereas in the other cases beating was recorded via six or seven electrodes. All beat rates differed statistically significantly form each other (P < 0.001), and the beat rates observed during treatment were statistically significantly different from the beat rate without treatment by P < 0.0001, as given by the two-sample t test. B and C: An example of conduction of electrical activation in an HS346-derived cardiomyocyte culture. B: A microscope image of a part of the culture and nine microelectrodes. The inter-electrode distance is 500 µm and electrode diameter 30 µm. C: Single beats recorded via the electrodes a, b, c, and d, marked in B. The electrical activation is conducted from cells near the electrode a, via the vicinity of the electrode b, to cells near the electrodes c and d. The signals seen in A and C were low-pass filtered in Matlab (The MathWorks, Inc., Natick, MA, USA) with a passband end frequency of 100 Hz for plotting.
Supplementary Table 1. Primer sequenses.
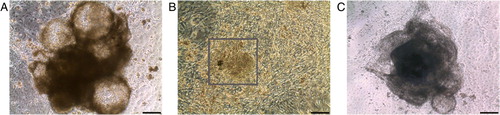
Supplementary Figure 1. Co-cultures of human embryonic stem cells with mouse visceral endodermal cells (END-2 cells). A: HS293 forms cystic structures that grow upwards from the bottom of the well. B: HS346 forms layer-like beating areas (marked by square), as well as compact three-dimensional beating areas (C). Scale-bar 200 µm.
Supplementary Figure 2. Relative gene expression of bone morphogenic protein-4 (BMP-4) (A), kinase insert domain receptor (KDR)(B), alphafetoprotein (AFP) (C), and SRY sex-determining region Y-box 1 (SOX1) (D) and SRY sex-determining region Y-box 17 (SOX17) (E) in HS181, HS293, HS346, and HS368 at day 3 and 6. QPCR protocol was 10 minutes at + 95°C followed by 40 cycles of 15 seconds at + 95°C and 60 seconds at + 60°C. At the end of the program a dissociation curve protocol was performed to demonstrate that the results are not due to the primer-dimers or non-specific PCR products. From both time points we had two biological replicates which were run as triplicates. For every PCR plate, negative control reactions without cDNA were run to monitor the reliability of the test.
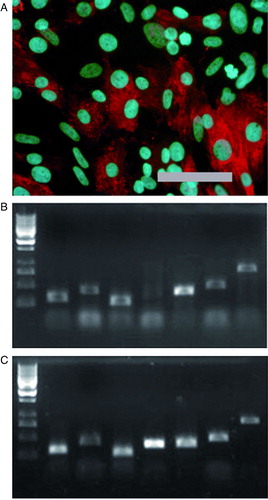
Supplementary Figure 3. A: Differentiated cells stain positively for anti-α-myosin heavy chain. Scale-bar 200 µm. B: Differentiated cells (line HS181 p83) express same cardiac markers compared to commercial heart RNA. C: Size estimation was done with GeneRuler 1 kb DNA Ladder (Fermentas, USA); four smallest fragments are 250, 500, 750, and 1000 bp. Markers from left are β-actin (control), α-myosin heavy chain, atrial myosin light chain, ventricular myosin light chain, troponin T type 2, GATA-4, and connexin-45.
Supplementary Figure 4. A: Electron micrograph showing longitudinally organized myofibrils (arrows). Arrowheads point to developing Z lines (m = mitochondria; pr = polyribosomes; l = lipid droplets). B: Immunoelectron micrograph showing troponin I immunoreactivity in myofibrils (arrows). Arrowheads point to non-labeled area probably representing H band. Scale-bar 500 nm.