Figures & data
Figure 1. Enzymatic degradation of gliadin analyzed by HPLC-MS (A–D) and SDS-PAGE (E). A: HPLC-MS elution pattern of untreated gliadin, full-range m/z = 480–2000. B: Pepsin-trypsin-digested gliadin (PT-G) and PT-G pretreated with germinating wheat enzymes (PT-G + enzymes), full-range m/z = 480–2000. C: 12-mer and 33-mer standard gliadin peptides eluted at 16.5 and 23.3 min, respectively; m/z = 728–730 for 12-mer and 1304–1306 for 33-mer. D: Pretreatment of PT-G with germinating wheat enzymes reduced the levels of 12-mer and 33-mer significantly when compared to PT-G; m/z = 728–730 for 12-mer and 1304–1306 for 33-mer. E: SDS-PAGE analysis of gliadin degradation by wheat enzymes. Lane 1 = standards; lane 2 = gliadin; lane 3 = gliadin + heat-inactivated germinating wheat enzymes; lane 4 = gliadin + germinating wheat enzymes.
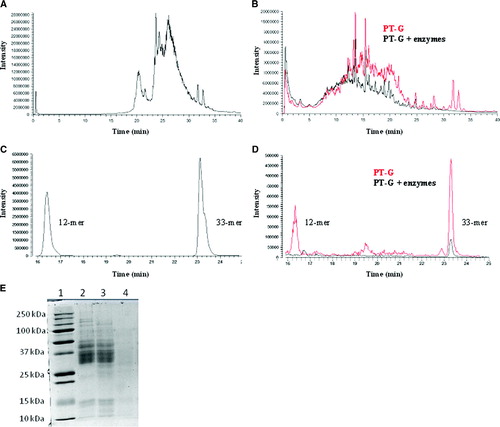
Figure 2. Transepithelial resistance of Caco-2 cells treated with study compounds: medium only (open circles), pepsin and trypsin-digested bovine serum albumin (open squares), pepsin and trypsin-digested gliadin (black squares), germinating wheat enzyme-pretreated pepsin-trypsin digest of gliadin (black circles). Data are given as mean values±SEM derived from three independent experiments performed in duplicate. Statistical analyses by two-tailed Mann-Whitney U test. NS = not significant; P<0.05 was considered significant.
Figure 3. The extent of actin cytoskeleton rearrangement measured as a percentage of Caco-2 cell cluster edge covered by membrane ruffles treated with medium only, pepsin-trypsin-digested bovine serum albumin (PT-BSA), pepsin-trypsin-digested gliadin (PT-G), and germinating wheat enzyme-pretreated pepsin-trypsin-digested gliadin (PT-G + enzymes). A: Representative images of membrane ruffle formation after different treatments. Arrows point to membrane ruffles. Magnification 20×. B: Toxicity of PT-G as measured by the extent of membrane ruffling is abolished by pretreatment of PT-G with germinating wheat enzymes. Data are given as mean values±SEM derived from three independent experiments performed in duplicate. Statistical analyses by two-tailed Mann-Whitney U test. NS = not significant; P<0.05 was considered significant.
Figure 4. The appearance of Caco-2 cell tight junctions after treatment with medium only, pepsin-trypsin-digested bovine serum albumin (PT-BSA), pepsin-trypsin-digested gliadin (PT-G), and germinating wheat enzyme-pretreated pepsin-trypsin-digested gliadin (PT-G + enzymes). Pictures are representative images from experiments performed in duplicate three independent times. Magnification 100×.
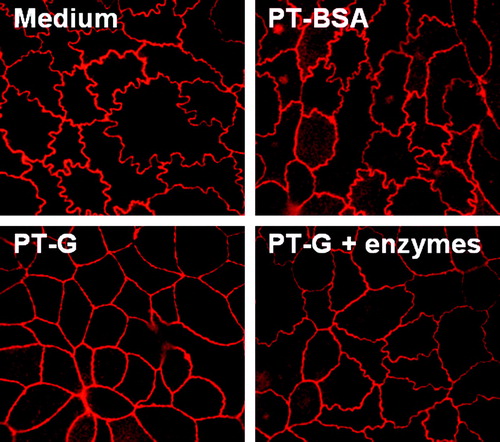
Figure 5. The T cell proliferation as measured by 3H-thymidine incorporation is decreased after germinating wheat enzyme pretreatment of pepsin-trypsin-digested gliadin (PT-G). A: The dose-dependent T cell proliferation of TCC436.5.6 that recognizes the DQ2-αII-epitope found within the 33-mer. B: Proliferation of TCC387.19 that recognizes the DQ2-γVII-epitope. C: The proliferation of TCL496.1.2 that is reactive to the DQ2-γII-epitope but not the 33-mer. D: The proliferation of TCL KT.CD.E3 that is reactive to the 33-mer and the DQ2-γIV and DQ2-γVI-epitopes. Data are given as mean values±SEM (TG2 = transglutaminase 2; PT-BSA = pepsin-trypsin-digested bovine serum albumin; CPM = counts per minute).
Figure 6. A: The secretion of transglutaminase 2 autoantibodies (U) to the organ culture supernatants was significantly increased in small-bowel mucosal explants derived from untreated celiac disease patients after 48 hours’ challenge with pepsin-trypsin-digested gliadin (PT-G). When the explants were incubated with germinating wheat enzyme-pretreated pepsin-trypsin-digested gliadin (PT-G + enzymes), the autoantibody levels remained at control level with medium only. Duodenal explants from healthy controls did not respond to any treatment. B: In the cultured biopsy samples from untreated celiac disease patients, the density of CD25-positive T cells in the mucosal lamina propria increased significantly after PT-G challenge. This toxic effect was markedly diminished when gliadin was pretreated with germinating wheat enzymes. No significant changes were seen in biopsies from healthy controls. Data are given as mean values±SEM. Statistical analyses by the two-tailed Wilcoxon signed ranks test. NS = not significant; P<0.05 was considered significant.
