Figures & data
Table I. Rest and stress findings in the study population and in control group.
Table II. Rest echo changes over time.
Figure 1. Transthoracic echocardiography: time course of left ventricular four-chamber view (top) and Doppler-derived coronary flow reserve (CFR) on left anterior descending coronary artery (middle) and on right coronary artery (bottom) at day 1 (acute phase), at discharge, and 6 months after discharge. Top: end-systolic frame showing a large akinetic apex at admission (rest WMSI) and improving at discharge (rest WMSI), with complete recovery of regional function after 6 months (rest WMSI). Middle panel: coronary flow velocity profile at base-line and after dipyridamole on LAD at each time point as for wall motion score index (WMSI). Bottom panel: coronary flow velocity profile at base-line and after dipyridamole on right coronary artery at each time point as for WMSI.
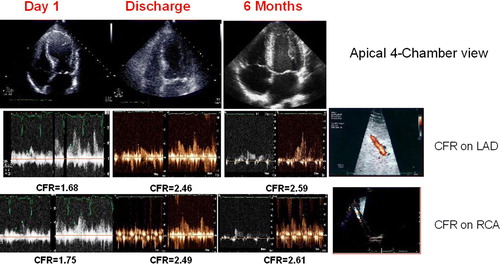
Figure 2. Coronary flow reverse (CFR) in the left anterior descending artery (LAD) area (white boxes) and in the right coronary artery (RCA) area (black boxes) in control subjects, at admission (acute), at discharge (subacute), and at 6-month follow-up (values are expressed as means±SD).
Figure 3. Correlation between CFR on LAD and rest WMSI at admission, at discharge, and at 6-month follow-up.
Figure 4. Correlation between CFR on LAD and peak WMSI at admission, at discharge, and at 6-month follow-up.