392
Views
14
CrossRef citations to date
0
Altmetric
Original Article

Increased plasma interleukin-1 receptor antagonist levels in men with visceral obesity

, , , , , & , FAHA , PhD show all
Pages 471-478 | Received 29 Jan 2009, Published online: 01 Sep 2009

Figures & data

Table I.  Anthropometric and metabolic characteristics of the study.

Table II.  Spearman correlation coefficients between concentrations of IL-1Ra and indices of adiposity and cardiometabolic risk variables.

Figure 1.  Respective contributions of plasma IL-1Ra levels and visceral AT to the variance in metabolic risk variables (fasting insulin (A), area under the curve (AUC) of plasma insulin (B), triglycerides (C), and cholesterol/HDL cholesterol ratio (D)) in the different subgroups (1, 2, 3, 4) classified on the basis of the 50th percentile of visceral AT and IL-1Ra. Because variables were skewed, P-values of the log-transformed values are presented in panels A, B, and C (1, 2, 3 = significantly different from the corresponding subgroups; P < 0.05). IL-1Ra = interleukin-1 receptor antagonist; AT = adipose tissue; HDL = high-density lipoprotein.
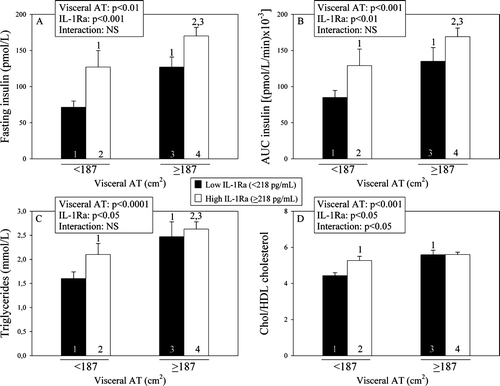
Figure 1.  Respective contributions of plasma IL-1Ra levels and visceral AT to the variance in metabolic risk variables (fasting insulin (A), area under the curve (AUC) of plasma insulin (B), triglycerides (C), and cholesterol/HDL cholesterol ratio (D)) in the different subgroups (1, 2, 3, 4) classified on the basis of the 50th percentile of visceral AT and IL-1Ra. Because variables were skewed, P-values of the log-transformed values are presented in panels A, B, and C (1, 2, 3 = significantly different from the corresponding subgroups; P < 0.05). IL-1Ra = interleukin-1 receptor antagonist; AT = adipose tissue; HDL = high-density lipoprotein.

Figure 2.  Plasma IL-1Ra levels among subgroups of men classified on the basis of their number of cardiometabolic risk variables. a = significantly different from score 0: P < 0.05 on log-transformed values; b = significantly different from score 1: P < 0.05 on log-transformed values; c = significantly different from score 2: P < 0.05 on log-transformed values. HDL = high-density lipoprotein; AUC = area under the curve; IL-1Ra = interleukin-1 receptor antagonist.
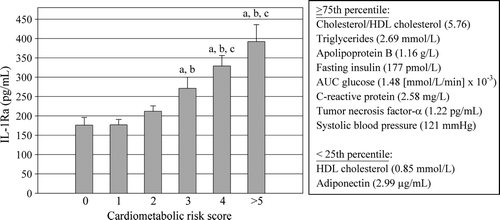
Figure 2.  Plasma IL-1Ra levels among subgroups of men classified on the basis of their number of cardiometabolic risk variables. a = significantly different from score 0: P < 0.05 on log-transformed values; b = significantly different from score 1: P < 0.05 on log-transformed values; c = significantly different from score 2: P < 0.05 on log-transformed values. HDL = high-density lipoprotein; AUC = area under the curve; IL-1Ra = interleukin-1 receptor antagonist.

Table III.  Multiple regression analyses for relative contributions of fat distribution and IL-1Ra to the variance in indices of plasma glucose-insulin homeostasis and lipids.

Reprints and Corporate Permissions

Please note: Selecting permissions does not provide access to the full text of the article, please see our help page How do I view content?

To request a reprint or corporate permissions for this article, please click on the relevant link below:

Academic Permissions

Please note: Selecting permissions does not provide access to the full text of the article, please see our help page How do I view content?

Obtain permissions instantly via Rightslink by clicking on the button below:

If you are unable to obtain permissions via Rightslink, please complete and submit this Permissions form. For more information, please visit our Permissions help page.