Figures & data
Table 1. Production capacity, capital cost, energy consumption and GHG emissions for San Diego, Almeria and Riyadh.
Figure 1. San Diego charges a low, average-cost price (P1) on water, such that quantity demanded (Q1) justifies the more expensive desalinated supply (Sd). Prices at P2 (representing the marginal cost of desalinated water) would result in a lower quantity demanded (Q2) and thus no need for additional, desalinated supplies. Source: Author elaboration.
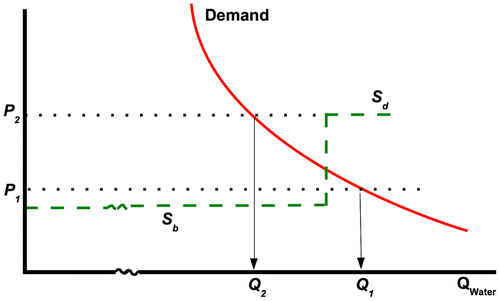
Figure 2. Satellite photo of Campo Dalías, Almería. Source: NASA Jet Propulsion Laboratory (Citation2011).
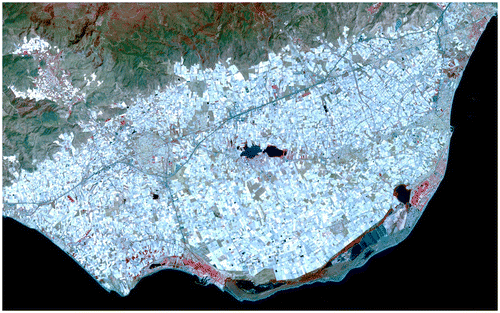
Figure 3. Farmers can afford to pay for desalinated water (Sd) although it costs more than groundwater (Sb), but weak regulations allow them to unsustainably over-draft groundwater for lower-valued uses, such that quantity Q1 is demanded, rather than the sustainable quantity Q2. Source: Author elaboration.
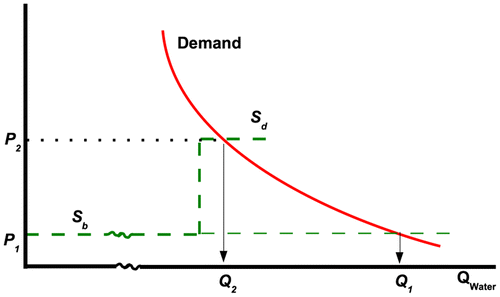
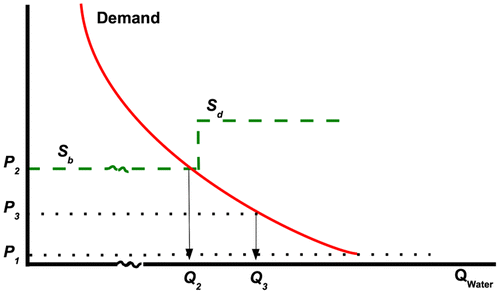
Figure 4. The cost of supply from groundwater (Sb) and desalination (Sd) is much higher than the price of water (P1). Excess demand at that price is cut back by interruptions in service, such that the shadow price of water is P3 and the quantity demanded is Q3. Source: Author elaboration.