Figures & data
Figure 1. Hydrological and irrigated areas in the Segura basin. Source: Own elaboration with data from the Segura River Basin Authority.
Note: TST = Tagus-Segura Transfer.
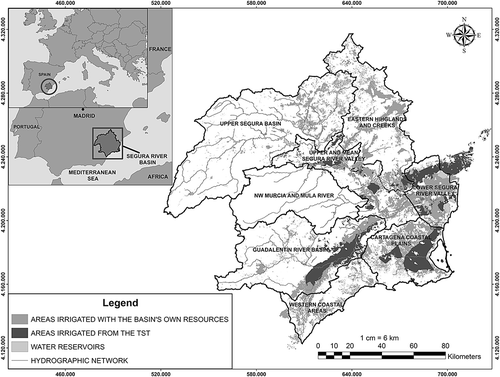
Figure 2. Annual volume of water traded between users of the Segura River basin and price interval (volumes in Mm3; prices in €/m3; 2000–15). Source: Own elaboration with information supplied by the Segura River Basin Authority, SCRATS (Citation2015) and buyers. Prices are at source, not including VAT or transportation costs.
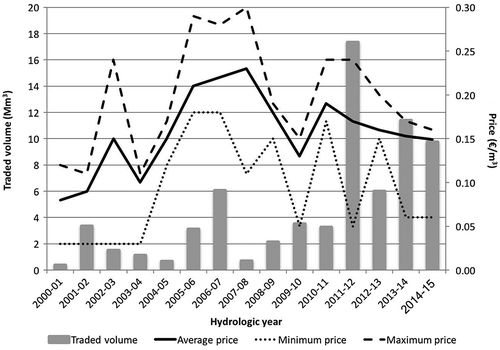
Table 1. Lease contracts between Segura River basin and Tagus River basin users.
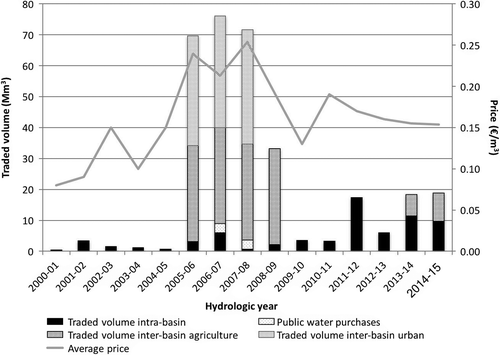
Figure 3. Annual volume of water purchased by users in the Segura River basin and average price paid (volumes in Mm3; prices in €/m3; 2000–15). Source: Own elaboration with information supplied by the Segura River Basin Authority, SCRATS (Citation2015) and buyers. Prices are at source, not including VAT or transportation costs.