Figures & data
Table 1. Data used in this study
Figure 1. Histogram of population in terms of mean annual precipitation (mm/year).
Figure 2. Histogram of population in terms of available precipitation water (m3/capita/year).
Figure 3. Histogram of population in terms of annual runoff (mm/year).
Figure 4. Spatial distribution of available freshwater (m3/capita/year).
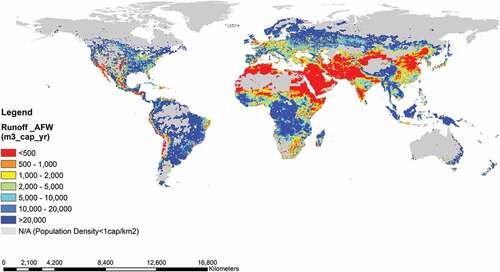
Figure 5. Histogram of population in terms of available freshwater (m3/capita/year).
Table 2. Distribution of population by water availability
Figure 6. Histogram of population in terms of net total annual withdrawal (m3/capita/year).
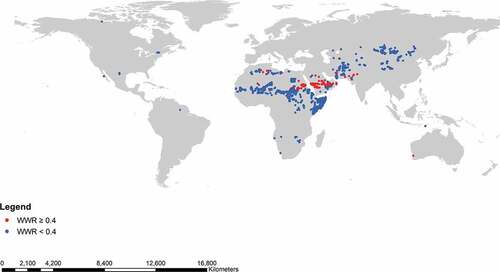
Figure 7. Spatial distribution of water stress represented by withdrawal-to-available-water ratio (WWR).
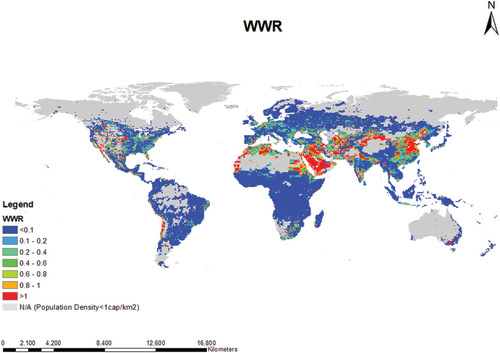
Table 3. Distribution of population by water stress
Figure 8. Histogram of population in terms of withdrawal-to-available-water ratio.
Figure 9. Scatter plot of water availability per capita and GDP-PPP per capita analyzed by 0.5° longitudinal and latitudinal grid boxes.
Figure 10. Scatter plot of water availability and GDP-PPP per capita by country-level analysis.
Figure 11. Longitudinal and latitudinal grid boxes (0.5° × 0.5°) showing areas below the threshold line of both economically poor and water-scarce.