
Figures & data
Table 1. Overview of citizen contributions to local flood risk management (FRM)
Table 2. Overview of key interviewees and interview codes
Figure 1. Map of Arnhem showing the extent of the 2014 floods (dark blue shows areas that were flooded)
(source: Arnhem-North Pluvial Flooding Approach, Citation2015).
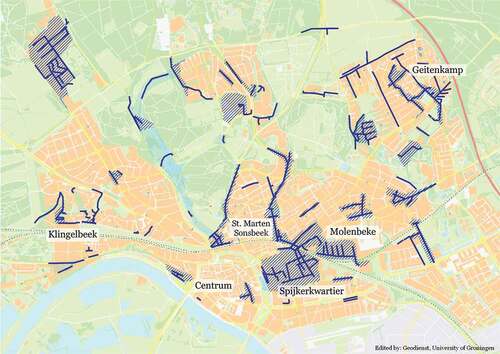
Table 3. Citizen contributions to local pluvial flood risk management (FRM) identified in Arnhem