
Figures & data
Figure 1. Influencing pathways of perceptions, adoption and impacts of integrated water management technology (IWMT).
Table 1. Variable definition and summary statistics.
Table 2. Mean differences of variables between integrated water management technology (IWMT) adopters and non-adopters.
Figure 2. Farmers’ perceptions of fertilizer and water-saving levels through integrated water management technology (IWMT) adoption: (a) perceptions of fertilizer-saving levels; and (b) perceptions of water-saving levels.
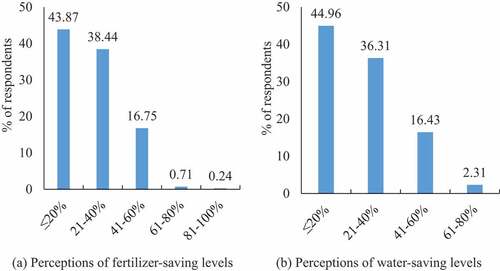
Figure 3. Farmers’ perceptions of the integrated water management technology (IWMT) adoption with respect to technology similarity, operability, economic benefit and others’ attitudes: (a) technology similarity; (b) operability; (c) economic benefit; and (d) others’ attitudes.
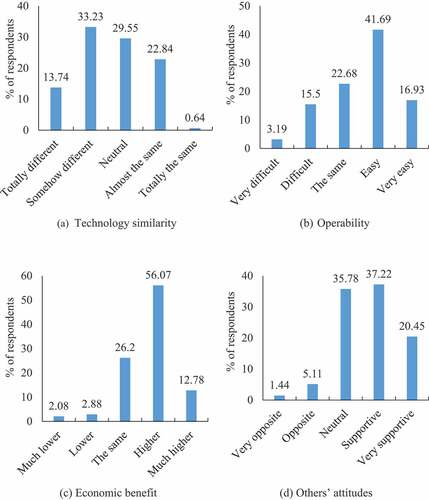
Table 3. Pearson correlation coefficients between perceptions variables and integrated water management technology (IWMT) adoption.
Table 4. Average treatment effects of integrated water management technology (IWMT) adoption on outcome variables: propensity score matching (PSM) estimator.
Table 5. Average treatment effects by gender of household head and land size: nearest-neighbour matching (NNM) (1–3 matching).
Figure A1. Distributions and common support for propensity score matching (PSM).
Table A1. Variable definition and summary statistics of perception variables.
Table A2. Matching quality test: balancing property.
Table A3. Propensity score matching (PSM) and covariate balance: nearest-neighbour matching (NNM) (1–3 matching).
Table A4. Rosenbaum bounds for sensitivity analysis of IWMT adoption on outcome variables.
Table A5. Average treatment effects of IWMT adoption on outcome variables: IPWRA estimator.