Figures & data
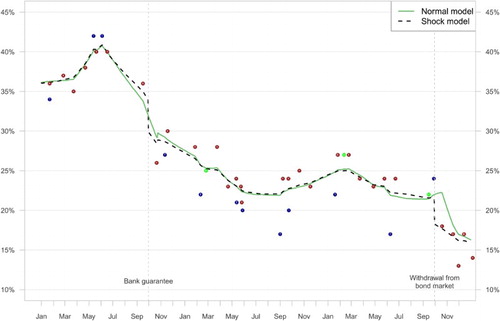
Figure 1. Support for Fianna Fáil, Fine Gael, Labour, Sinn Féin and the Progressive Democrats 1987–2016. Note: Mean estimates and 95% credible intervals (shaded). The dots represent election results.
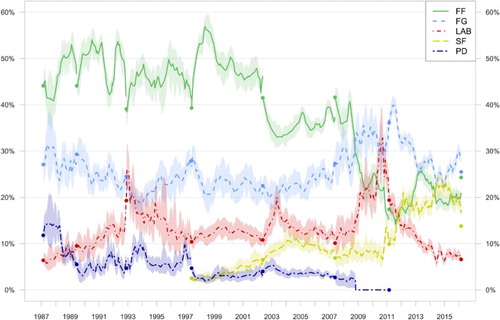
Figure 2. Support for the Green Party, Worker's Party, Democratic Left and Others 1987–2016. Note: Mean estimates and 95% credible intervals (shaded). The dots represent election results. For the ‘Others’ category, the parties included in it vary from election to election.
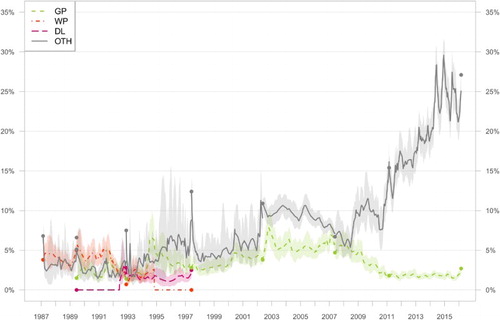
Figure 3. A comparison between final Polling Indicator estimates and General Election results.
Figure 4. House effects in the Irish Polling Indicator (2011–2016). Note: dots display house effect for each pollster (95% credible intervals in black). ,
,
,
.
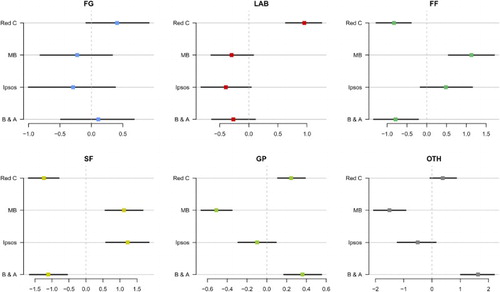
Figure 5. Design effects. Note: values indicate how many times larger the confidence intervals of individual poll estimates were estimated to be, compared to random sampling. A value of 1 would mean that the random error associated with the polls would be exactly the same as under random sampling. Larger values indicate that more error is associated with the poll estimates (error bars represent 95% credible intervals).
Figure 6. Support for Fianna Fáil 2008–2010. Note: Dots represent individual polls, colour coded: ,
,
. Credible intervals have been omitted from the figure for reasons of clarity.