Figures & data
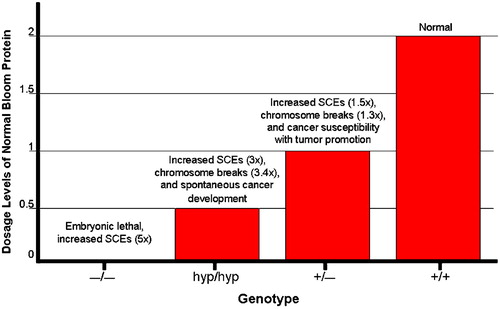
Figure 1. Structural features of the RecQ helicase catalytic core. The BLM helicase was modeled using the crystal structure of the catalytic core fromE. Coli RecQ (49–51) which only includes the helicase (yellow) and RQC (light blue) regions. Additionally, the seven helicase motifs and RQC domain are each displayed in a different color which corresponds to the schematic diagram (top): motif I (red), Ia (orange), II (dark blue), III (green), IV (purple), V (cyan), VI (fuchsia). The N and C termini and conserved HRDC domain (all shown in black) are not included in the structural representation of BLM. Diagram consisting of α‐helices (cylinders), β‐sheets (arrows), and variable regions (ribbons). The ATP binding site is indicated with an arrow (red). The E. coli RecQ structure was used to map 10 corresponding positions of 12 characterized BS missense mutations, shown with their original amino acid side chains. The mutations are indicated with an arrow (black) and listed as follows with the corresponding E. coli RecQ residue in parentheses. Helicase region: Gln672Arg (Gln30), Gly891Glu (Gly239), Cys901Tyr (Val249), Gly952Val (Gly299), His963Tyr (His310), Cys878Arg (Leu227); RQC region: Cys1036Phe (Cys380), Cys1055Ser (Gly392), Cys1055Gly (Gly392), 1055Arg (Gly392), Asp1064Val (Asp401), Cys1066Tyr (Cys402).
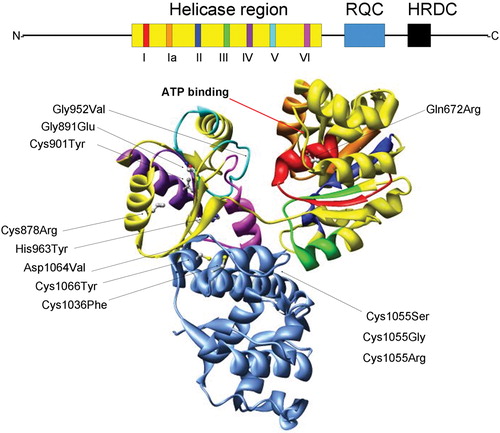
Table I. The first 100 cancers documented in the Bloom's Syndrome Registry.
Figure 2. Distinct phenotypes observed in mice that express varying levels of Bloom protein: graphical depiction of the relationship between the level of normal BLM expression on the one hand and genomic instability and cancer susceptibility on the other. The null BLM−/− mutation which results in the complete absence of BLM protein causes embryonic lethality. Hypomorphic BLMhyp/hyp mice produce 25% of the normal Bloom protein level and exhibit increased SCEs (3‐fold higher than normal) and chromosome breakage (3.4‐fold higher), accompanied by spontaneous cancer development. Heterozygous BLM+/− mice produce 50% of the normal BLM protein levels and also exhibit increased SCEs (1.5‐fold higher than normal), chromosome breakage (1.3‐fold higher), and cancer susceptibility in the Apc min mouse.