
Figures & data
Table 1. Gender differences in socio-demographic characteristics.
Table 2. Gender differences in clinical characteristics of a sample enrolled in the study
Figure 1. Scatterplots of SBP against DBP showing the prevalence of systolic, diastolic or both systolic and diastolic hypertension among men (A) and women (B).
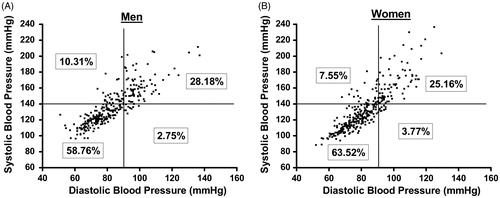
Figure 2. Correlation analysis showing the relationship between blood pressure and age (A and B) or BMI (D and E) for men and women. Graphs C and F show the slope of increase in BP with age or BMI, respectively. * p < 0.05.
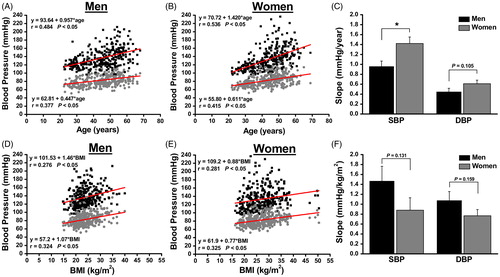
Figure 3. The prevalence of hypertension for each age interval (A) or BMI category (B) is shown for men and women. Graphs C and D show the gender-specific SBP and DBP for each age interval or BMI category, respectively.
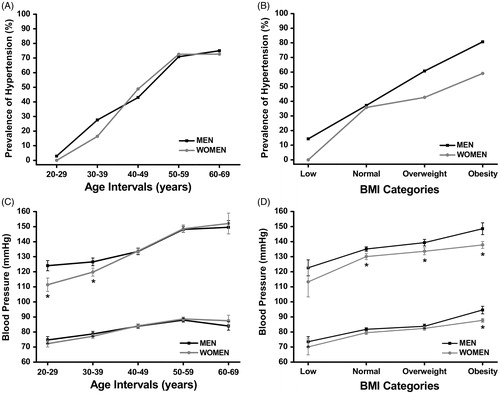
Table 3. Multiple regression coefficients stratified by gender.
Table 4. Crude and adjusted odds ratio for hypertension stratified by gender.