
Figures & data
Table 1. Characteristic of the patients in the study.
Figure 1. Blood pressure and arterial stiffness in RA and AS patients and in the control group. A. Blood pressure and mean arterial pressure (mmHg); B. Central blood pressure and central pulse pressure (mmHg); C. Pulse wave velocity (m/s); D. Aortic pulse wave augmentation (AG); E. AIx augmentation indexes. There were no statistically significant differences between the groups after age and sex standardization (p > .05).
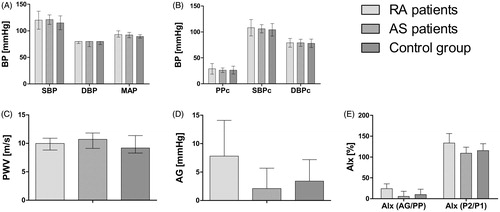
Table 2. Inflammatory markers in RA and AS patients and in the control group.
Supplemental material