
Figures & data
Figure 1. Box and whiskers plot with the top and bottom boundaries of the box representing interquartile range and the line in the box representing the mean value. The whiskers show the upper and lower extremes, excluding outliers. PDC, proportion of days covered with NSAID treatment 180 days prior to the last blood pressure measurement. Significant differences between men and women are shown as *p < .05, and ***p < .001.
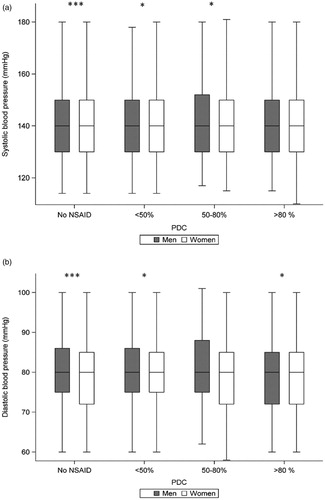
Figure 2. Achieved target blood pressure (<140/90 mm Hg) in patients without NSAID (reference group) and in patients with NSAID, divided into different PDC groups according to gender Presented as odds ratio by a logistic regression model adjusted for age, gender, smoking, antihypertensive drug class, cardiovascular comorbidity, education, ethnicity, and musculoskeletal disease. BP: blood pressure; PDC: proportion of days covered with NSAID treatment 180 days prior to the last blood pressure measurement.
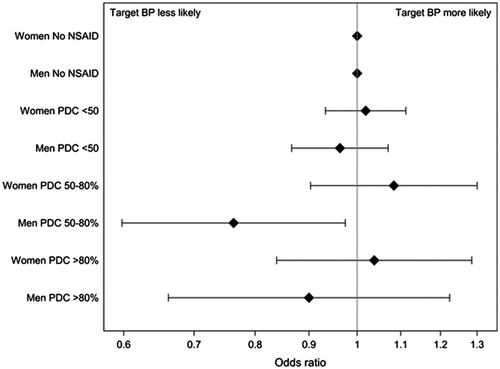
Table 1. Patients characteristics of 38,251 patients with and without a prescription of NSAID 180 days prior to the last blood pressure measurement.
Figure 3. (a–c) Regression models presented with a spline curve with upper and lower 95% CI (dashed line), analysing changes in SBP from a reference daily dose (naproxen 250 mg, diclofenac 50 mg, and ibuprofen 200 mg). Data for naproxen (a; n = 256), diclofenac (b; n = 475), and ibuprofen (c; n = 286) were adjusted for age, gender, smoking, number of antihypertensive drugs, cardiovascular comorbidity, education, ethnicity, and musculoskeletal disease.
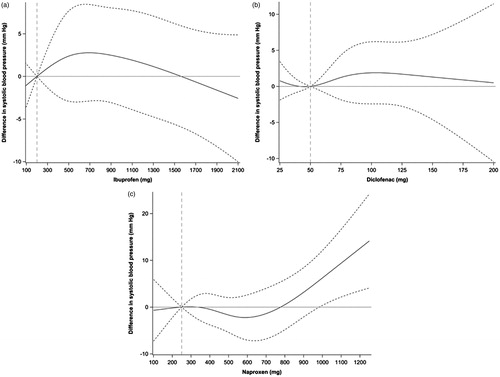
Table 2. Controlled blood pressure in relation to treatment with NSAID by renal function.