
Figures & data
Table 1. Demographic and clinical characteristics of the population evaluated.
Figure 1. Left: direct correlation between Th1 lymphocytes (%) and reactive oxygen species in the subcutaneous tissue biopsies (ROS) (unit per area). Right: inverse correlation between total TREGs (absolute number) and reactive oxygen species in the subcutaneous tissue biopsies (ROS) (unit per area).
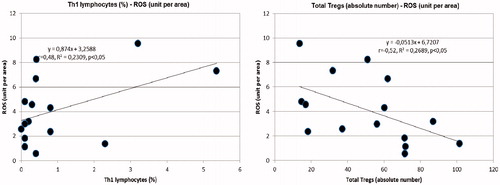
Figure 2. Left: inverse correlation between RTE TREGs (%) and reactive oxygen species in the subcutaneous tissue biopsies (ROS) (unit per area). Right: inverse correlation between RTE TREGs (absolute number) and reactive oxygen species in the subcutaneous tissue biopsies (ROS) (unit per area).
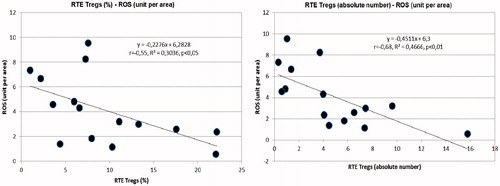
Figure 3. Left: inverse correlation between EM TREGs (absolute number) and reactive oxygen species in the subcutaneous tissue biopsies (ROS) (unit per area). Right: inverse correlation between small resistance arteries TREG (unmethylated FoxP3) and circulating C Reactive Protein.
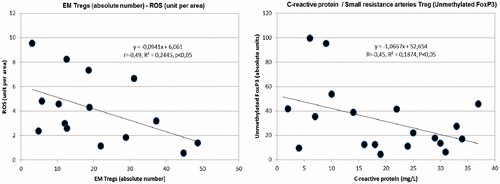
Figure 4. Increased circulating levels of monocyte chemoattractant peptide-1 (MCP-1) (pg/ml) in hypertensive patients compared with normotensive subjects.
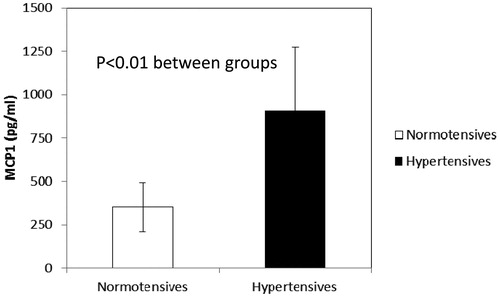
Table 2. Correlations observed with indices of oxidative stress