
Figures & data
Figure 1. (a) The association of average temperature with blood pressure standardized by average humidity; (b) The association of average humidity with blood pressure standardized by average temperature; The association of average temperature with blood pressure among total population standardized by average humidity stratified by gender (c), age group (d) and health examination type (e).
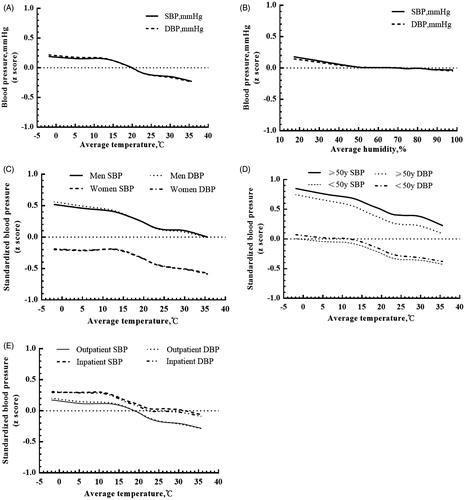
Figure 2. Monthly and yearly average of prevalence of hypertension.
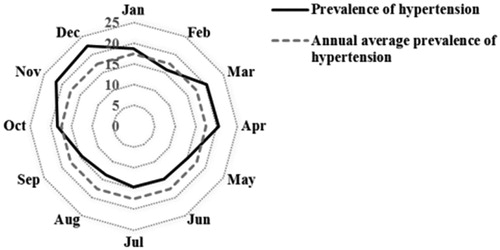
Table 1. Distribution of sociodemographic characteristics among population taking health examination by season.
Table 2. AdjustedTable Footnotea association of temperature and humidity with blood pressure.
Table 3. AdjustedTable Footnotea association of temperature and humidity with blood pressure among total population stratified by season.
Table 4. AdjustedTable Footnotea association of temperature with blood pressure in four seasons in inpatient and outpatient health examination.