494
Views
5
CrossRef citations to date
0
Altmetric
Original Article

The association between changes in blood pressure components and incident cardiovascular diseases

, , , , &
Pages 341-349 | Received 06 Apr 2017, Accepted 07 Jul 2017, Published online: 14 Jul 2017

Figures & data

Figure 1. Outline of the selection design of study participants. SBP: systolic blood pressure, DBP: diastolic blood pressure, 2h-PCG: 2-hour post challenge plasma glucose, FPG: fasting plasma glucose, CVD: cardiovascular disease.

Figure 1. Outline of the selection design of study participants. SBP: systolic blood pressure, DBP: diastolic blood pressure, 2h-PCG: 2-hour post challenge plasma glucose, FPG: fasting plasma glucose, CVD: cardiovascular disease.

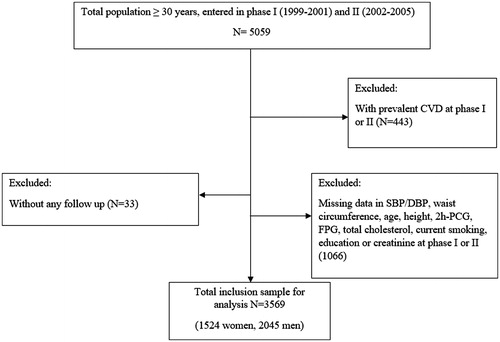
Table 1. Comparison of baseline characteristics between respondents and non-respondents.

Table 2. Blood pressure parameters’ changing values (n = 3569) between 1999–2001 and 2002–2005.

Figure 2. Multivariate Cox proportional hazard analysis of 1 SD increase in the change of different blood pressure components between 1999–2001 and 2002–2005, for incident cardiovascular diseasesa. Model I: baseline measurements of gender, age and the main exposure; model II: Model I + baseline value of related blood pressure measurement; model III: Model II + baseline measurements of DBP/SBP, family history of CVD, eGFR, BMI, waist circumference, diabetes mellitus, hypertension drugs, current smoking, hypercholesterolemia and education level; model IV (only for SBP and DBP change): model III + changing value of SBP or DBP as appropriate. a: 1 SD change of SBP change: 13.8 mm Hg; 1 SD change of DBP change: 9.14 mm Hg; 1 SD change of PP change: 12.9 mm Hg and 1 SD change of MAP change: 9.5 mm Hg; systolic blood pressure (SBP); diastolic blood pressure (DBP); pulse pressure (PP); mean arterial pressure (MAP); body mass index (BMI); estimated glomerular filtration rate (eGFR); main exposures: SBP change, DBP change, MAP change and PP change.

Figure 2. Multivariate Cox proportional hazard analysis of 1 SD increase in the change of different blood pressure components between 1999–2001 and 2002–2005, for incident cardiovascular diseasesa. Model I: baseline measurements of gender, age and the main exposure; model II: Model I + baseline value of related blood pressure measurement; model III: Model II + baseline measurements of DBP/SBP, family history of CVD, eGFR, BMI, waist circumference, diabetes mellitus, hypertension drugs, current smoking, hypercholesterolemia and education level; model IV (only for SBP and DBP change): model III + changing value of SBP or DBP as appropriate. a: 1 SD change of SBP change: 13.8 mm Hg; 1 SD change of DBP change: 9.14 mm Hg; 1 SD change of PP change: 12.9 mm Hg and 1 SD change of MAP change: 9.5 mm Hg; systolic blood pressure (SBP); diastolic blood pressure (DBP); pulse pressure (PP); mean arterial pressure (MAP); body mass index (BMI); estimated glomerular filtration rate (eGFR); main exposures: SBP change, DBP change, MAP change and PP change.

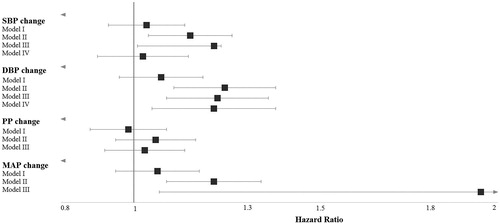
Table 3. Hazard ratios for predicting cardiovascular disease in different models of systolic/diastolic blood pressure, pulse pressure and mean arterial pressure change with respect to changing tertilesTable Footnotea.

Supplemental material

Supplementary__R3_-BP_change.docx

Download MS Word (54.5 KB)

Reprints and Corporate Permissions

Please note: Selecting permissions does not provide access to the full text of the article, please see our help page How do I view content?

To request a reprint or corporate permissions for this article, please click on the relevant link below:

Academic Permissions

Please note: Selecting permissions does not provide access to the full text of the article, please see our help page How do I view content?

Obtain permissions instantly via Rightslink by clicking on the button below:

If you are unable to obtain permissions via Rightslink, please complete and submit this Permissions form. For more information, please visit our Permissions help page.