
Figures & data
Table 1. Frequency of occurrence of concomitant diseases in the investigated population.
Table 2. Blood pressure and heart rate values as measured by compared methods.
Figure 1. Bland-Altman analysis of systolic and diastolic BP values recorded with SpaceLabs 90207 (SPL 90207) and mercury sphygmomanometer (MS), both during AFib and after restoration of sinus rhythm. Continuous line represents mean value of differences, while dotted lines show ±1SD. On X-axis the average value of BP measured simultaneously by SpaceLabs 90207 and mercury sphygmomanometer is presented.
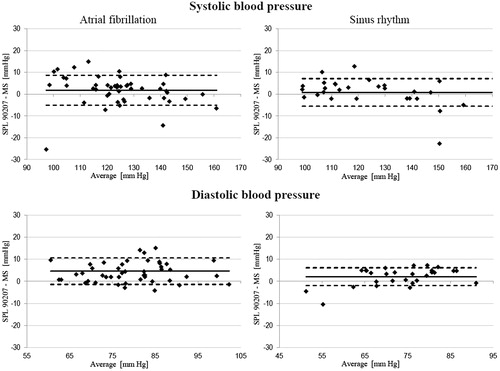
Table 3. Average differences, standard deviations as well as percentage differences of 5, 10 and 15 mm Hg, between the systolic (SBP) and diastolic (DBP) BP values recorded with SpaceLabs 90207 device (SPL 90207) and mercury sphygmomanometer (MS). Data obtained both, during AFib and after restoring sinus rhythm.