Figures & data
Table 1. Demographic, haemodinamic and clinical data of enrolled subject.
Figure 1. ΔPWV in age decades group.
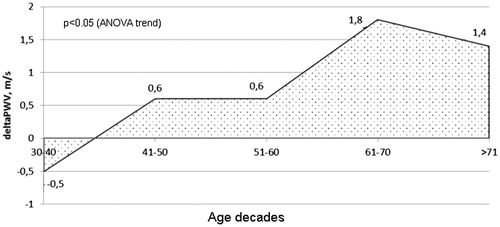
Table 2. Blood Pressure and PWV data of enrolled subject when divided accordingly to age decades at baseline.
Table 3. Demographic, haemodinamic, clinical and laboratory data of enrolled subject when divided accordingly to controlled of uncontrolled blood pressure values at follow-up evaluation.
Figure 2. ΔPWV of enrolled subject when divided accordingly to controlled or uncontrolled blood pressure values at follow-up evaluation.
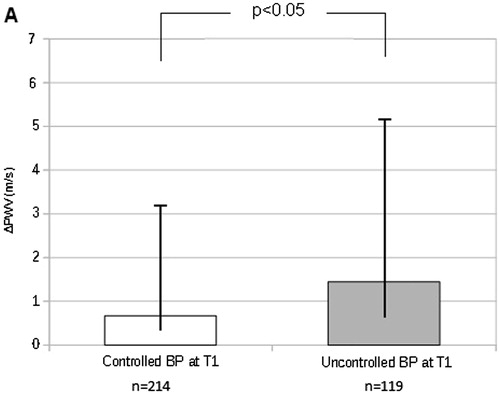
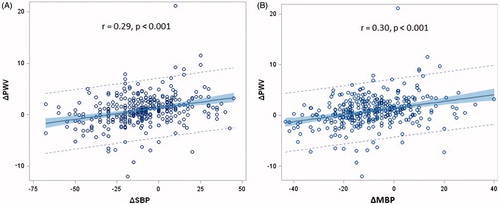
Figure 3. Correlation between ΔPWV and ΔSBP (panel A) and ΔMBP (panel B).