Figures & data
Table 1. Socio-demographic characteristics of the 2071 children participating in the Australian Health Survey, with blood pressure measurement.
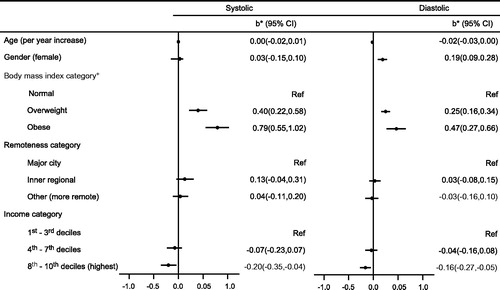
Figure 1. Univariate associations, using simple linear regressions, between BP z-score and socio-demographic variables for the 2071 children participating in the Australian Health Survey. *b – estimated regression coefficient indicating the average increase in the blood pressure z-score per unit of the continuous covariates and mean difference to the reference category in the categorical covariates; CI – confidence interval.
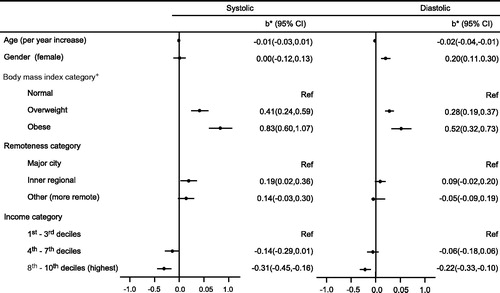
Figure 2. Adjusted associations, using a multiple linear regression, to predict BP z-score, between BP z-score and socio-demographic variables for the 2071 children participating in the Australian Health Survey. *b – estimated regression coefficient indicating the average increase in the blood pressure z-score per unit of the continuous covariates and mean difference to the reference category in the categorical covariates, adjusted for all the other variables in the model; CI – confidence interval.