Figures & data
Figure 1. Illustration of BP variability calculation1. For each observed BP measurement (xi), the deviation (di) is defined as the distance to the regression line, or the absolute value of the residual (observed minus predicted value).
1Deviation variables were calculated as follows:
![](/cms/asset/b1ae20df-0281-4e21-9e92-f1b1add83777/iblo_a_1382310_um0001.gif)
![](/cms/asset/4c70f7e1-5972-426c-8851-526f93d256b7/iblo_a_1382310_um0002.gif)
![](/cms/asset/4ff6591d-8c20-4482-8c31-62913618b5bd/iblo_a_1382310_um0003.gif)
![](/cms/asset/9a20c9ae-e0e2-4dbb-bf16-fe6a63de00ca/iblo_a_1382310_um0004.gif)
![](/cms/asset/cfc0c2e7-d408-4f81-8bf6-6f61e36a9a39/iblo_a_1382310_um0005.gif)
![](/cms/asset/213d5485-cc17-45d5-9025-d91a60df0e8e/iblo_a_1382310_um0006.gif)
![](/cms/asset/55f0a01d-1c97-456f-9d4d-7ff63d0a9391/iblo_a_1382310_um0007.gif)
![Figure 1. Illustration of BP variability calculation1. For each observed BP measurement (xi), the deviation (di) is defined as the distance to the regression line, or the absolute value of the residual (observed minus predicted value).1Deviation variables were calculated as follows:](/cms/asset/77c0cc24-6621-4875-a959-9ae07845d7a1/iblo_a_1382310_f0001_b.jpg)
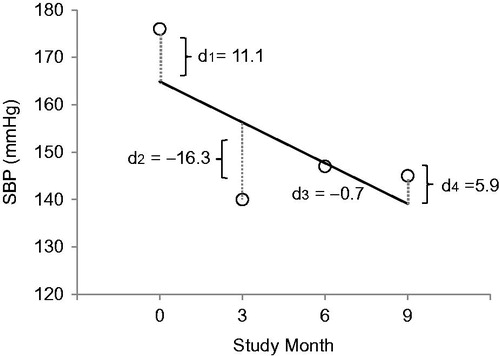
Table 1. Summary of candidate BP measures selected a priori for the derivation of cluster membership (among SPS3 participants in lower SBP target group).
Figure 2. Association of baseline SBP with SBP variability, stratified by cluster membership. Blue open circles and solid line denote cluster 1. Red plus symbols and dashed line denote cluster 2. Green x symbols and dash/dot line denote cluster 3. Elliptical curves denote 95% confidence regions for each cluster.
![Figure 2. Association of baseline SBP with SBP variability, stratified by cluster membership. Blue open circles and solid line denote cluster 1. Red plus symbols and dashed line denote cluster 2. Green x symbols and dash/dot line denote cluster 3. Elliptical curves denote 95% confidence regions for each cluster.](/cms/asset/3aaa051a-9c2f-4e0b-92ef-8eb4187166ae/iblo_a_1382310_f0002_c.jpg)
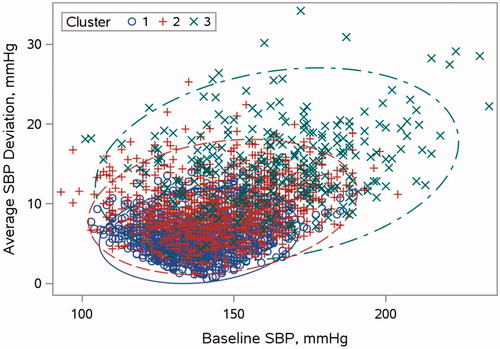
Table 2. Baseline characteristics of SPS3 participants by cluster stratified by lower and higher BP target groups.
Table 3. Association of cluster with outcomes in SPS3 participants (among participants in the lower BP target group).