Figures & data
Figure 1. Example of a measuring sequence. In this example, the first sequence is OmronR7-OmronHEM907TM, the second is OmronR7- Microlife WatchBPHome™. In this sequence, the OmronR7 is the first device in both sequences (“device A”), both arm devices are “device B” in this example.
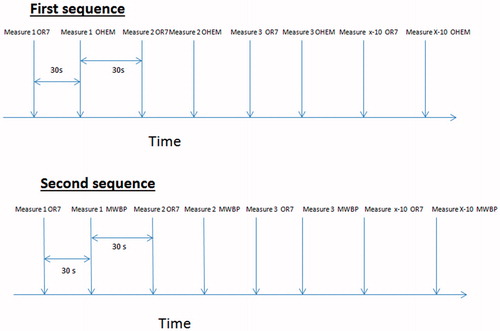
Table 1. Characteristics of the sample.
Table 2. Performance of arm devices.
Table 3. Intraclass correlations according to device (arm measurements).
Table 4. Reliability regarding the diagnosis of hypertension between intra-arterial and peripheral blood pressure measurement.
Figure 2. Bland & Altman plot between Microlife WatchBPhome™ and Invasive Blood Pressure. The Microlife WatchBPhome™ systematically overestimated systolic and diastolic blood pressure.
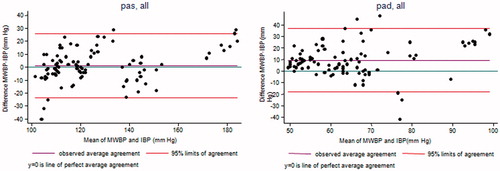
Figure 3. Bland & Altman plot between OmronHEM907™ and Invasive Blood Pressure. The OmronHEM907™ systematically underestimated systolic and diastolic blood pressure.
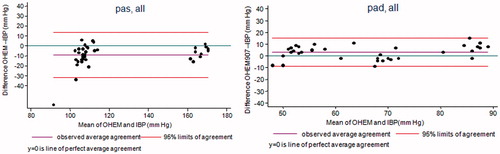
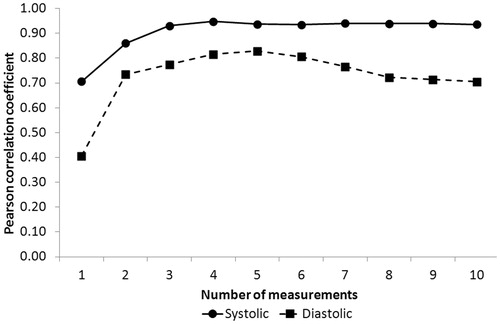
Figure 4. Pearson correlation coefficient (SBP and DBP) between Microlife WatchBPHomeTM and Invasive Blood Pressure according to the number of consecutive measurements. After three consecutive blood pressure measurements, the improvement in the Pearson correlation coefficient is negligible.