
Figures & data
Figure 1. The proportion of BMI categories in boys and girls (Th1, thinness grade 1. Th2, thinness grade 2. Th3, thinness grade 3. Ob1, obesity grade 1. Ob2, obesity grade 2. Ob3, obesity grade 3. Nor, normal weight. Ov, overweight) *Gender difference p < .01.
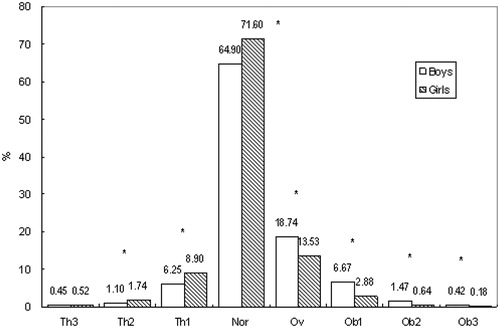
Table 1. The proportion of BMI categories in boys and girls aged 7–18 years.
Figure 2. Mean values of SBP and DBP for boys and girls with different BMI.
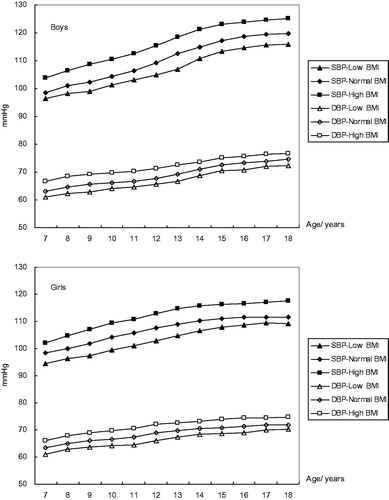
Table 2. Comparisons of Z-score of SBP and DBP and the prevalence of relatively high BP (RHBP) in different groups.