
Figures & data
Figure 1. (A) Movement of the vessel wall is tracked automatically and displayed on M-Mode. Waveforms changes in vessel diameter (distension wave) in real time (left side) and in the right side solid line shows the ultrasound beam direction for velocity measurements, whereas the dotted line shows the beam direction for measurements of diameter change. Both beams were steered to intersect at the center of the range gate. (B) Graphic: Carotid diameter change (top); blood pressure wave and electrocardiographic tracing (bottom). Representative output of carotid stiffness parameters.
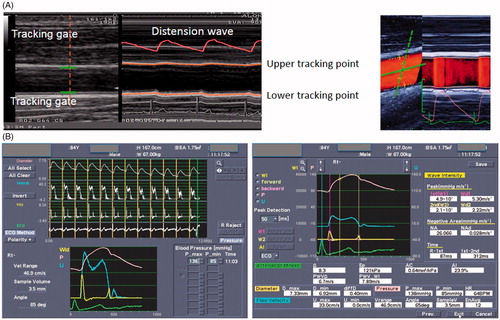
Table 1. General characteristics of the study population (n = 178).
Table 2. General characteristics of the hypertensive groups divided in tertiles according to mean night-time BP.
Table 3. Significant independent relation of left ventricular parameters, diastolic function and left atrium with local and regional arterial stiffness, hemodynamic parameters, age and life-style habits.
Table 4. Significant independent relation of local and regional stiffness parameters with hemodynamic parameters, age and life-style habits.
Appendix 1. Pearson simple correlation between BPs measurements and carotid and regional stiffness.
Appendix 2. Pearson simple correlation between BPs measurements and left ventricular structure and diastolic function.
Appendix 3. Pearson simple correlation between local and regional stiffness parameters and left ventricular structure and diastolic function.
Appendix 4. Difference in 24 h ambulatory BP parameters between non-dippers and dippers.