
Figures & data
Table 1. Baseline characteristics of patients with or without atrial fibrillation at baseline, and of patients who developed or did not develop atrial fibrillation during follow-up.
Figure 1. Standard deviation of visit-to-visit systolic blood pressure in patients with or without atrial fibrillation at baseline, and in patients who developed or did not develop atrial fibrillation during follow-up. Data are boxplots of median (solid horizontal line), interquartile range (box outline), minimum, and maximum (whiskers). Extreme values are not shown. No atrial fibrillation at baseline: mean SD 10.0 mm Hg (SD 5.1); Atrial fibrillation at baseline: mean SD 10.3 mm Hg (SD 5.6); No atrial fibrillation during follow-up: mean SD 9.9 mm Hg (SD 5.1); Non-persistent atrial fibrillation during follow-up: mean SD 11.1 mm Hg (SD 5.3); Persistent atrial fibrillation during follow-up: mean SD 11.7 mm Hg (SD 5.5).
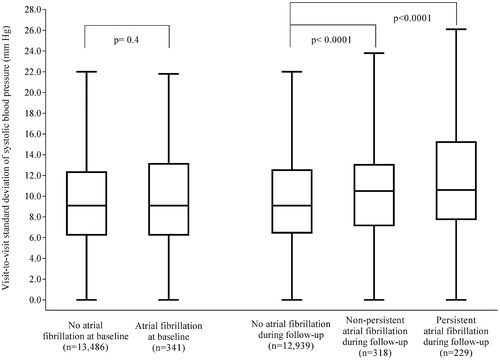
Figure 2. Standard deviation of within-visit systolic blood pressure in patients with or without atrial fibrillation at baseline, and in patients who developed or did not develop atrial fibrillation during follow-up. Data are boxplots of median (solid horizontal line), interquartile range (box outline), minimum, and maximum (whiskers). Extreme values are not shown. No atrial fibrillation at baseline: mean SD 4.0 mm Hg (SD 2.1); Atrial fibrillation at baseline: mean SD 4.1 mm Hg (SD 2.3); No atrial fibrillation during follow-up: mean SD 4.0 mm Hg (SD 2.1); Non-persistent atrial fibrillation during follow-up: mean SD 4.1 mm Hg (SD 2.1); Persistent atrial fibrillation during follow-up: mean SD 4.3 mm Hg (SD 2.1).
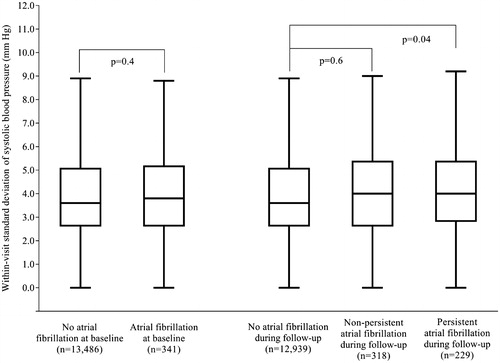
Table 2. Difference in standard deviation of visit-to-visit systolic blood pressure between patients with and without atrial fibrillation at baseline and between patients who developed and did not develop atrial fibrillation during follow-up.