
Figures & data
Table 1. Age and sex adjusted characteristics of the study population in tertiles of atherogenic index of plasma.
Table 2. Explanatory factors for haemodynamic variables in linear regression analyses with stepwise elimination.
Figure 1. Averages of radial systolic (A) and diastolic (B) blood pressure, and aortic systolic (C) and diastolic (D) blood pressure in age- and sex-adjusted tertiles of atherogenic index of plasma (AIP) during 5-minute recordings in the supine position. Tertile 1 (n = 202), Tertile 2 (n = 208), and Tertile 3 (n = 205); mean and 95% confidence interval; *p < .05 vs Tertile 1; †p < .05 vs Tertile 2, one-way ANOVA.
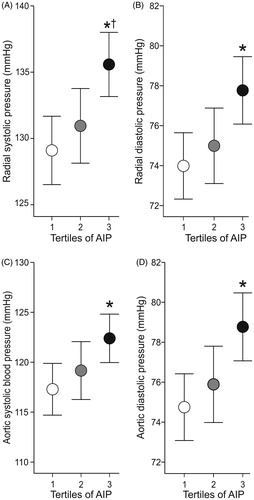
Figure 2. Averages of heart rate (A), cardiac index (B), and systemic vascular resistance index (C) in age- and sex-adjusted atherogenic index of plasma (AIP) during 5-minute recordings in the supine position; mean and 95% confidence interval; *p < .05 vs Tertile 1; †p < .05 vs Tertile 2, one-way ANOVA.
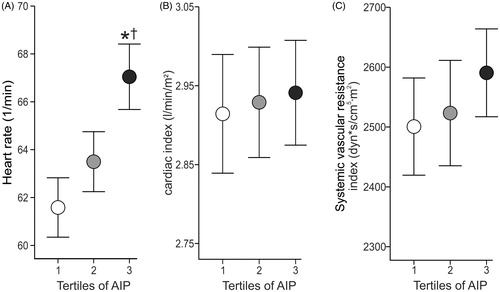
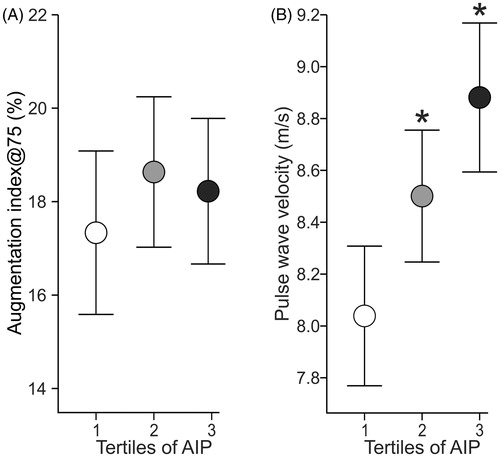
Figure 3. Averages of augmentation index adjusted to heart rate of 75 beats per minute (A), and pulse wave velocity (B) in age- and sex-adjusted atherogenic index of plasma (AIP) during 5-minute recordings in the supine position; mean and 95% confidence interval; *p < .05 vs Tertile 1; †p < .05 vs Tertile 2, one-way ANOVA.
Data availability
Analyses and generated datasets that support the current study are not available publicly. The datasets are available from the corresponding author on reasonable request.