Figures & data
Figure 1. Flowchart of the study. ABP indicates ambulatory blood pressure; BP blood pressure.
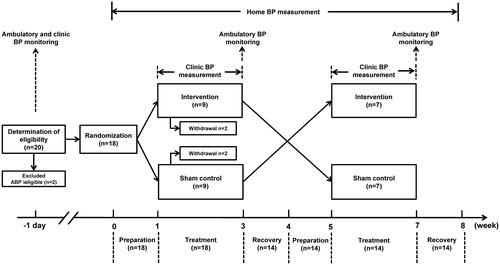
Table 1. Characteristics of the study subjects at baseline (n = 14).
Figure 2. Mean values of pulse rate and respiration before and after the intervention (dot with solid line) or sham control treatment session (circle with dashed line) in the clinic. Vertical lines denote standard deviation. P values are given for the within-treatment before and after treatment comparison and for the between-treatment comparison of the changes from before to after treatment.
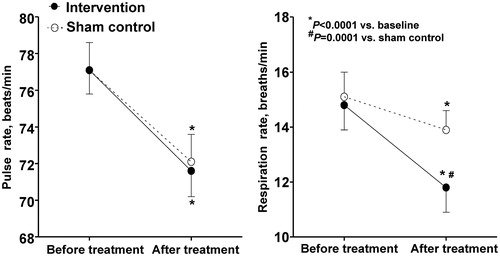
Table 2. Mean level and difference for respiration, clinic and ambulatory blood pressure between treatments.
Figure 3. 24-h systolic and diastolic blood pressure profile on the intervention (dot with solid line) and sham control treatments (circle with dashed line). Symbols denote hourly mean. Vertical lines denote standard deviation.
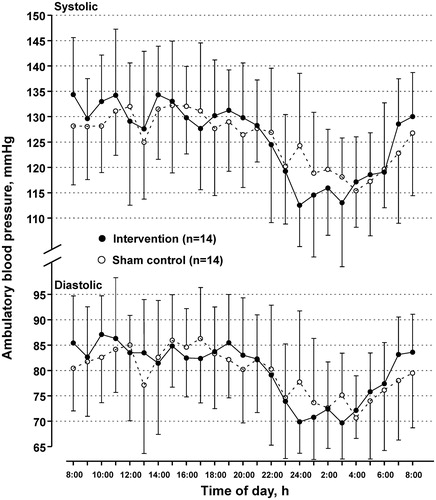
Table 3. Mean level and difference of morning and evening home blood pressure and pulse rate during the 2-week treatment and 1-week post-treatment recovery periods between treatments.
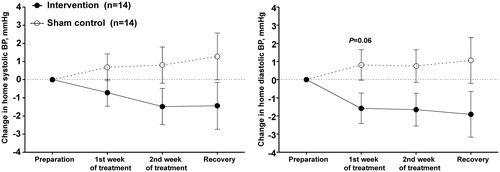
Figure 4. Least square mean change from the preparation period in the average of morning and evening home blood pressures during the treatment and recovery periods on the intervention (dot with solid line) and sham control treatments (circle with dashed line). Vertical lines denote standard error. The smallest P value is given for the between-treatment comparison alongside the symbol of the follow-up time point.