
Figures & data
Table 1. Baseline characteristics and new-onset diabetes during 21-year follow-up.
Table 2. Baseline characteristics according to dipping status.
Figure 1. Incidence of diabetes (%) according to dipping status. *p < 0.001 is for the Mantel-Haenszel linear-by-linear association.
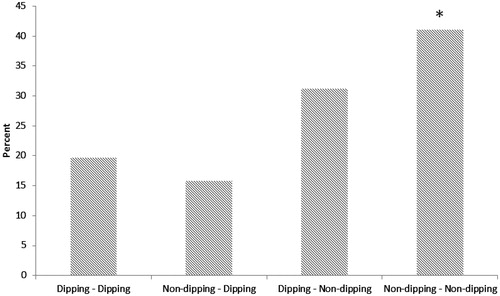
Table 3. Binary logistic regression model on the new-onset diabetes in 21-year follow-up.
Table 4. Change in variables during the 20-year follow-up and dipping status.