
Figures & data
Table 1. Characteristics of the study population.
Figure 1. Aortic PWV in the offspring and control group adjusted for major cofounders – results of the multivariate linear regression analysis.
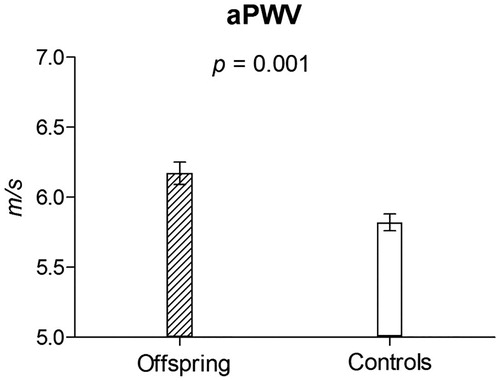
Figure 2. Soluble RAGE levels in the offspring and control group adjusted for major cofounders – results of the multivariate linear regression analysis.
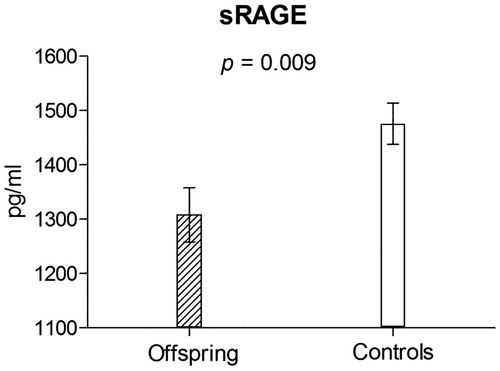
Table 2. Correlation analysis between sRAGE, aortic PWV and other cardiovascular risk factors.
Table 3. Determinants of the difference between offspring and controls – results of multivariate logistic regression analysis.
Supplemental material