
Figures & data
Table 1. Baseline demographics of study cohort, 2010‒2013.
Figure 1. Numbers of PTRA procedures performed in the period 2006–2013. The asterisk denotes the time of publication of the ASTRAL trial.
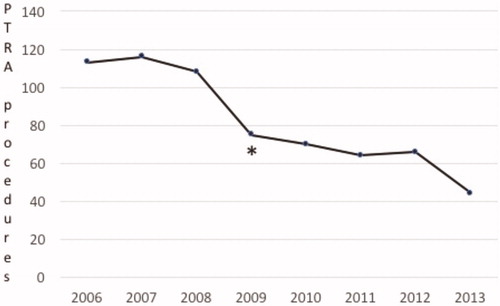
Table 2. Procedure-related data in 224 patients subjected to PTRA.
Table 3. Changes in blood pressure, renal function, and anti-hypertensive treatment over time in 224 patients subjected to PTRA.