Figures & data
Table 1. Demographic and clinical characteristics by gender, Czech post-MONICA studies 2006–2009 and 2015–2018.
Table 2. Ten-year trends in crude prevalence estimates of hyperuricaemia and CKD by gender.
Figure 1. Ten-year trends in the prevalence of hyperuricaemia (A) and CKD (B) by blood pressure status. CKD: chronic kidney disease; HT: hypertensives; NT: normotensives. *p < 0.05, **p < 0.005, ***p < 0.001. (A) Multivariate adjusted p values for the effect of the interaction between HT and hyperuricaemia on 10-year trends was 0.192 in men and 0.851 in women. (B) Multivariate adjusted p values for the effect of the interaction between HT and CKD on 10-year trends was = 0.001 in men and 0.011 in women. Each interaction analysis was adjusted for: age, education, current smoking, triglycerides, waist-to-height ratio > 0.5, diabetes, quartiles of alcohol intake, the use of xanthine-oxidase inhibitors, diuretics, and losartan, as well as for hyperuricaemia, CKD and HT per se.
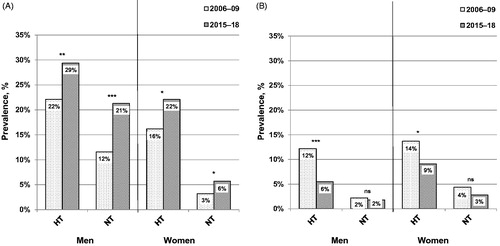
Figure 2. Multivariate logistic regression analysis showing the odds ratio of hyperuricaemia, chronic kidney disease, abdominal obesity, hypertension, diabetes, and the use of antihypertensive medication in 2015–18 vs. in 2006–09 in men. Abd. obesity: abdominal obesity; BB: beta blockers; CCBs: calcium channel blockers; CKD: chronic kidney disease; DM: diabetes mellitus; HT: arterial hypertension; RAS: renin-angiotensin-aldosterone system. *p < 0.05, **p < 0.005, ***p < 0 .001. (A) Total study population; n = 2803. (B) Hypertensive individuals; n = 1308. (C) Normotensive individuals; n = 1495. The year of survey (2015–2018 vs. 2006–2009) was used as a dependent variable. In addition to all factors graphically displayed, each multivariate logistic regression analysis was adjusted for: age, education, current smoking, triglycerides, and the use of xanthine-oxidase inhibitors. Further adjustment for quartiles of alcohol intake did not alter the results.
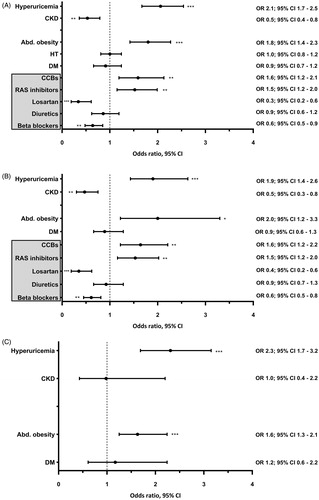
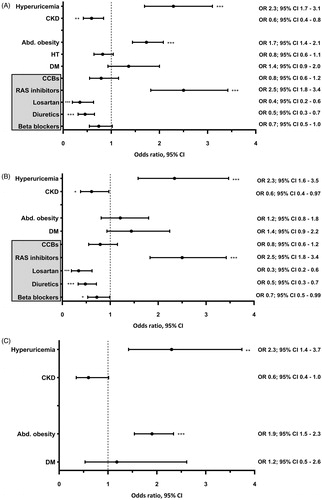
Figure 3. Multivariate logistic regression analysis showing the odds ratio of hyperuricaemia, chronic kidney disease, abdominal obesity, hypertension, diabetes, and the use of antihypertensive medication in 2015–18 vs. in 2006–09 in women. Abd. obesity: abdominal obesity; BB: beta blockers; CCBs: calcium channel blockers; CKD: chronic kidney disease; DM: diabetes mellitus; HT: arterial hypertension; RAS: renin-angiotensin-aldosterone system. *p < 0.05, **p < 0.005, ***p < 0.001. (A) Total study population; n = 3010. (B) Hypertensive individuals; n = 997. (C) Normotensive individuals; n = 2013. The year of survey (2015–2018 vs. 2006–2009) was used as a dependent variable. In addition to all factors graphically displayed, each multivariate logistic regression analysis was adjusted for: age, education, current smoking, triglycerides, and the use of xanthine-oxidase inhibitors. Further adjustment for quartiles of alcohol intake did not alter the results.