
Figures & data
Figure 1. Trial design. RDN: renal sympathetic denervation.
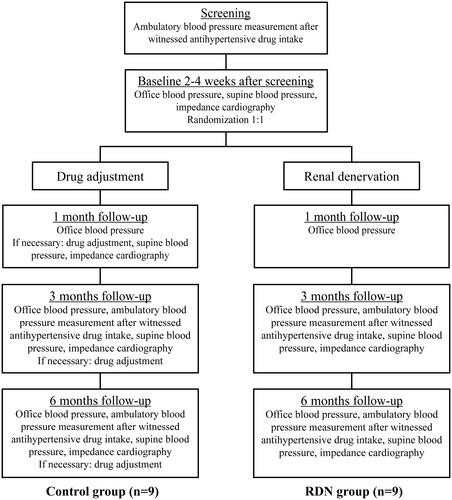
Table 1. Baseline characteristics.
Figure 2. Individual changes in systemic vascular resistance index in the RDN group. Panel A shows the SVRI levels for each individual at each time point in the RDN group (n = 9). The other panels show the change in SVRI for each individual from baseline to three months follow-up (panel B, n = 8), from three to six months follow-up (panel C, n = 9) and from baseline to six months follow-up (panel D, n = 8), the median is marked with a horizontal line. *p < 0.01 on Wilcoxon signed rank test (n = 9). RDN: renal sympathetic denervation; SVRI: systemic vascular resistance index.
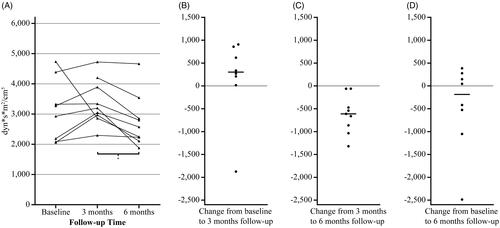
Table 2. Changes in hemodynamic variables in the RDN group.
Figure 3. Individual changes in systemic vascular resistance index in the control group. Panel A shows the SVRI levels for each individual at each time point in the control group (n = 10). Ticked line represents the participant with a deviant SVRI pattern, i.e. large changes that diverge strongly in opposite directions from the general pattern. The other panels (n = 9) show the change in SVRI for each individual from baseline to three months follow-up (panel B), from three to six months follow-up (panel C) and from baseline to six months follow-up (panel D), the median is marked with a horizontal line. *p = 0.01, †p < 0.01 on Wilcoxon signed rank test (n = 9). SVRI: systemic vascular resistance index.
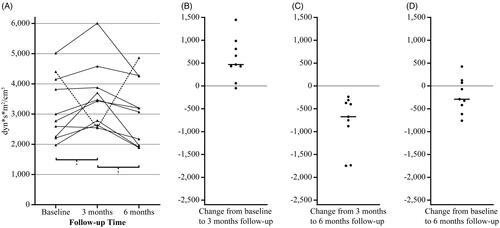
Table 3. Changes in hemodynamic parameters in the control group.