
Figures & data
Table 1. Baseline characteristics of the 4 groups of diabetic patients in which treatment reduced BP below 140/90 mmHg for different proportions (from < 25% to ≥ 75%) of the overall duration of treatment.
Figure 1. Incidence of morbid and fatal events in groups of diabetic patients divided according to the proportion of the overall treatment duration (< 25% to ≥ 75%) in which BP was reduced < 140/90 mmHg (upper panel) or < 130/80 mmHg (lower panel) prior to the occurrence of an event. n refers to the number of patients in each group. BP: blood pressure; CV: cardiovascular; MI: myocardial infarction; CHF: congestive heart failure.
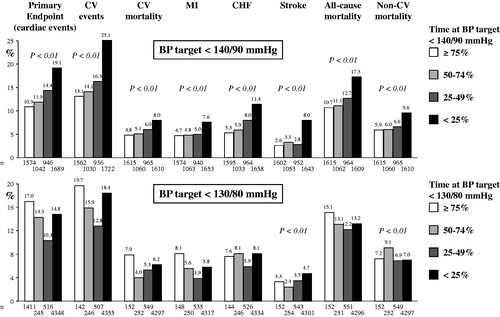
Figure 2. Percent (and 95% CI) change in the risk of events according to the proportion of time in which BP was reduced < 140/90 mmHg (upper panel) or < 130/80 mmHg (lower panel) in groups of diabetic patients. The group in which these BP targets were achieved for ≥ 75% of the time is used as reference and shown by the empty circle (minor variations in ‘n’ as some endpoints were composite and primary and other endpoints secondary). Data were adjusted for both baseline covariates and achieved average systolic BP and diastolic BP. P values refer to trend. NS: not significant. Other symbols as in .
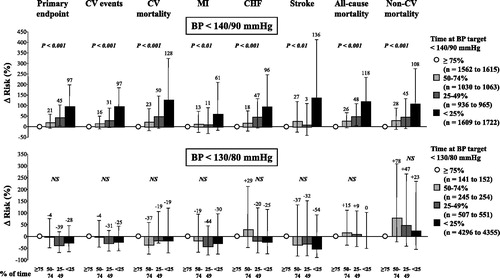
Table 2. Baseline characteristics of the 4 groups of diabetic patients in which treatment reduced BP below 130/80 mmHg for different proportions (from < 25% to ≥ 75%) of the overall duration of treatment.
Data availability statement
The data that support the findings of this study are available from the corresponding author, S.E.K. upon dire need.