Figures & data
Table 1. Characteristics of patients according to age group.
Table 2. Treatment of hypertension and diabetes mellitus according to age group.
Table 3. Prevalence of albuminuria according to blood pressure and age groups.
Table 4. Prevalence of ECG-left ventricular hypertrophy according to blood pressure and age groups.
Figure 1. Odds ratio relative to the whole age subgroup for albuminuria (left panel) and microalbuminuria (right panel). The analysis was adjusted for age, sex, body mass index, current smoking and alcohol intake, serum total cholesterol and triglycerides, heart rate, the presence of diabetes mellitus HbA1c level, duration of hypertension and the use of RAS inhibitors. Vertical lines denote 95% confidence intervals (CI). The number of participants for each subgroup is given in the parentheses. p values for trend and for significant odds ratios are given alongside the symbols.
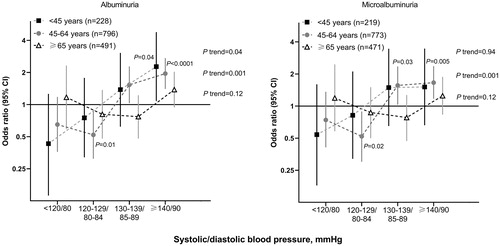
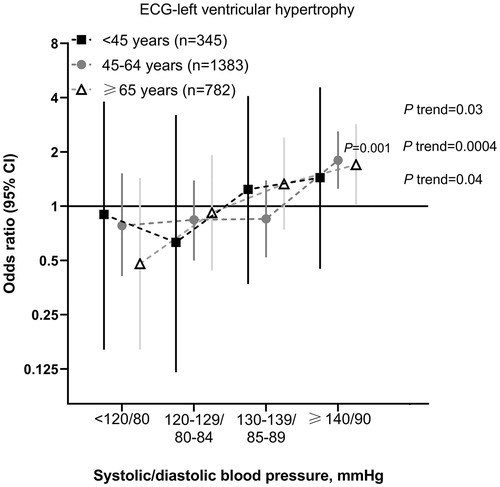
Figure 2. Odds ratio relative to the whole age subgroup for left ventricular hypertrophy. The analysis was adjusted for age, sex, body mass index, current smoking and alcohol intake, serum total cholesterol and triglycerides, heart rate, the presence of diabetes mellitus HbA1c level, duration of hypertension and the use of RAS inhibitors. Vertical lines denote 95% confidence intervals (CI). The number of participants for each subgroup is given in the parentheses. P values for trend and for significant odds ratios are given alongside the symbols.