
Figures & data
Table 1. Automated office and ambulatory systolic and diastolic blood pressure values.
Table 2. General characteristics.
Figure 1. Bland–Altman plot for systolic blood pressure for (a) 1-h AOBP vs 24-h ABPM and (b) AOBP vs daytime ABPM. The average blood pressure values on the x-axis are the combined blood pressure averages of AOBP and ABPM.
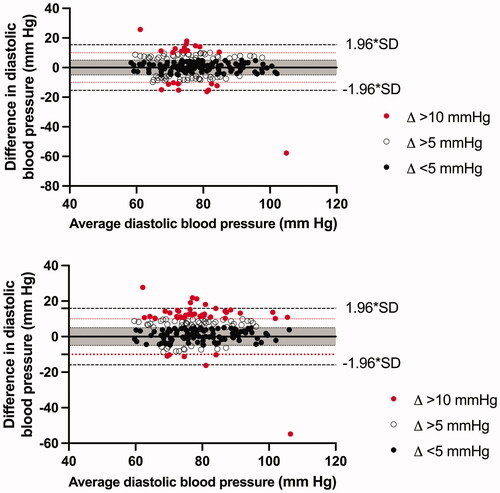
Figure 2. Bland–Altman plot for diastolic blood pressure for (a) 1-h AOBP vs 24-h ABPM and (b) AOBP vs daytime ABPM. The average blood pressure values on the x-axis are the combined blood pressure averages of AOBP and ABPM.
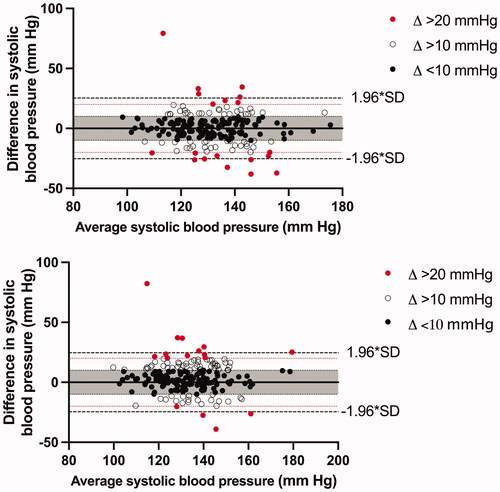
Table 3. Binary logistic regression analysis with (dis)agreement as outcome.
Supplemental material