Figures & data
Table 1. Age, body mass index (BMI), length of stay at the hospital, levels of angiotensin-converting-enzyme-2 (ACE2) angiotensin II, C-reactive protein (CRP), D-dimer, and troponin in hypertensive COVID-19 patients treated with ACE inhibitors (ACEi), angiotensin receptor blockers (ARB), beta-blockers (BB) and calcium channel blockers (CCB).
Figure 1. Circulating ACE2 (A) and angiotensin II (B) levels in COVID-19 hypertensive patients grouped according to disease severity (mild, moderate, and severe). Data are presented as dot plots with the mean (95% CI). Differences in log-transformed ACE2 and angiotensin II were assessed by ANOVA, *p < 0.05, **p < 0.01.
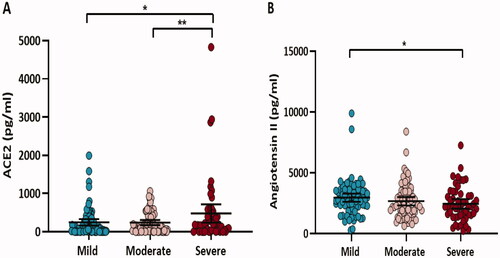
Figure 2. Circulating ACE2 and angiotensin II levels in COVID-19 hypertensive patients grouped according to two (ACEi/ARB, non-ACEi/ARB) (A, B) or four (ACEi, ARB, BB, and CCB) (C, D) medication groups. Differences in log-transformed ACE2 and angiotensin II were assessed by ANOVA, followed by Tukey's post-hoc analysis. *p < 0.05.
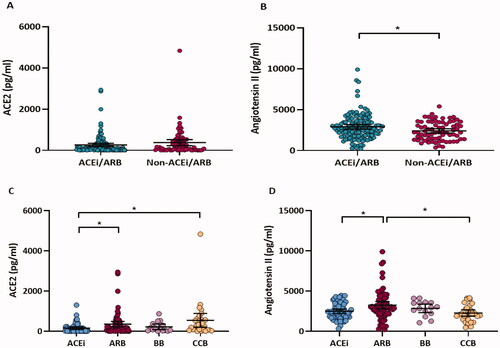
Figure 3. Circulating ACE2 (A) and angiotensin II levels (B) in hypertensive patients with different COVID-19 severity (mild, moderate, or severe) under each medication group (ACEi, ARB, BB, and CCB). Differences in ACE2 and angiotensin II levels were assessed by a linear regression model. *p < 0.05, **p < 0.01.
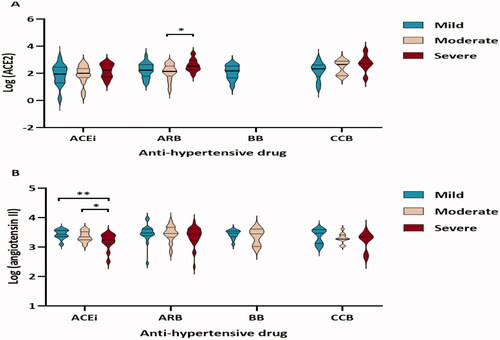
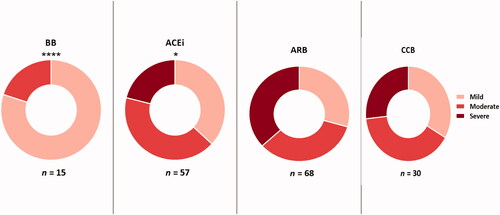
Figure 4. Comparing the percentage of hypertensive patients with different COVID-19 severity under each treatment group. The distribution of patients was compared using the Chi-square test. *p < 0.05, ****p < 0.0001.