Figures & data
Table 1. Baseline characteristics according to eGFR group.
Table 2. Circulatory measurements according to the eGFR group.
Figure 1. Relations between carotid-femoral pulse wave velocity (cfPWV) and eGFR. The solid regression line shows all 107 patients: bivariate correlation r = 0.40, p < 0.001; multivariate correlation slope = −1.9, R = 0.88, r = −0.20, p = 0.002. Broken line shows 74 patients without antihypertensive medication (only four cases had an eGFR <60 ml/min × 1.73m2), slope = −2.32, R = 0.58, r = −0.28 p = 0.08. The broken-dotted line shows 33 patients on antihypertensive medication (only two cases had a eGFR > 60 ml/min × 1.73m2), slope = −2.10, R = 0.63 r = −0.60, p = 0.003.
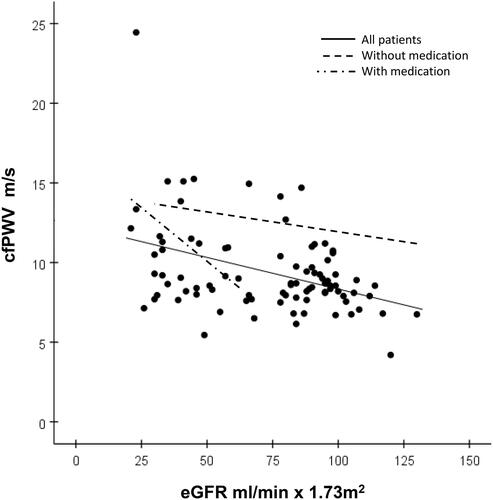
Figure 2. Relations between carotid-femoral pulse wave velocity (PWV) to carotid-radial PWV ratio (cfPWV/crPWV) and eGFR. The solid regression line shows all 107 patients: bivariate correlation r = 0.39, p < 0.001; multivariate correlation slope −14.8, R = 0.87, r = −0.16, p = 0.01. The broken line shows 74 patients without antihypertensive medication (only four cases had an eGFR <60 ml/min × 1.73 m2), slope = −19.3, R = 0.58, r = −0.23 p = 0.09. The broken-dotted line shows 33 patients on antihypertensive medication (only two cases had a eGFR > 60 ml/min × 1.73 m2), slope = −14.1, R = 0.50, r = −0.49 p = 0.03.
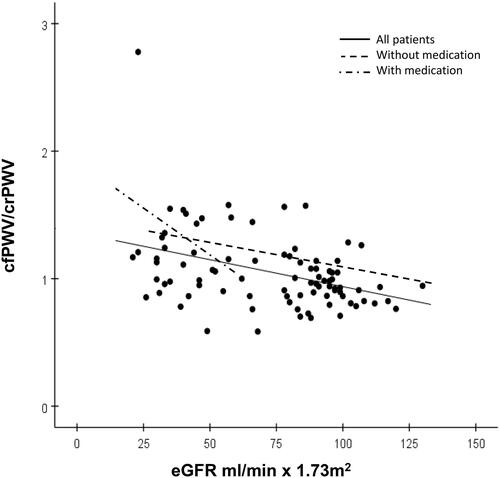
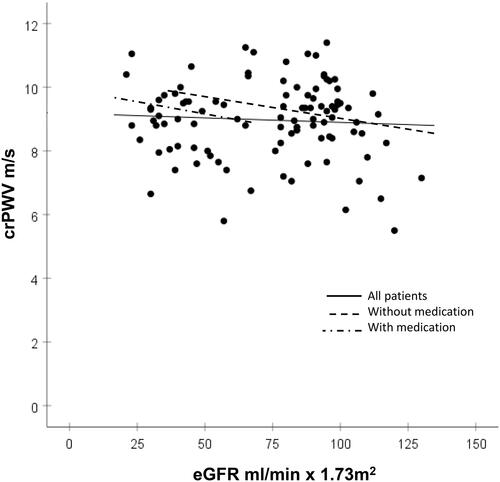
Figure 3. Relations between carotid to radial pulse wave velocity (crPWV) and eGFR. The solid regression line shows all 107 patients: bivariate correlation r = 0.07, p = 0.52, multivariate correlation slope = −1.47, R = 0.85, r = −0.07, p = 0.29. The broken line shows 74 patients without antihypertensive medication (only four cases with eGFR <60 ml/min × 1.73m2), slope = −0.28, R = 0.53, r = −0.02, p = 0.88. The broken-dotted line shows 33 patients on antihypertensive medication (only two cases with eGFR > 60 ml/min × 1.73m2), slope = −3.54, R = 0.35, r = −0.36, p = 0.18.