
Figures & data
Figure 1. Mean home blood pressure (BP) during the current European guideline-based 7-day HBPM protocol (2 measurements per day).
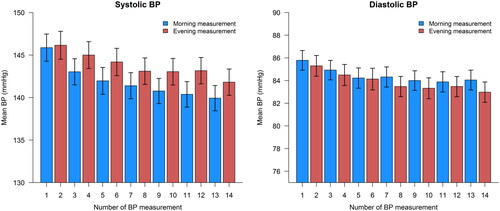
Table 1. Characteristics of the study population. All data in n (%) or mean ± standard deviation.
Figure 2. Maximal deviation from home blood pressure of an increasing number of successive home BP readings for 95% of individuals. Positive deviation calculated as 1.96 × standard error of average BP + systematic bias of average BP. Negative deviation calculated as −1.96 × standard error of average BP − systematic bias of average BP.
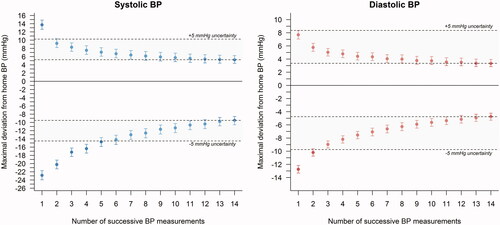
Figure 3. Maximal deviation from home blood pressure of an increasing number of successive home BP readings for 95% of individuals with (blue circles), and without (red squares) BP readings taken on day 1. Positive deviation calculated as 1.96 × standard error of average BP + systematic bias of average BP. Negative deviation calculated as −1.96 × standard error of average BP − systematic bias of average BP.
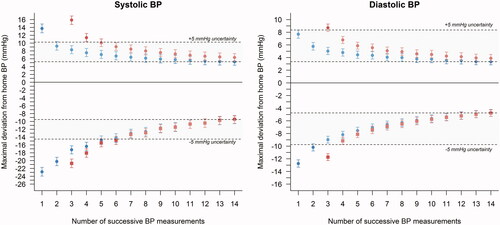
Figure 4. Agreement of home hypertension status is determined with an increasing number of successive BP readings expressed by the kappa (ĸ) statistic. Home hypertension: Mean home systolic blood pressure (BP) ≥135 mm Hg or home diastolic BP ≥85 mm Hg. Good agreement: 95% lower confidence limit (LCL) of the κ statistic ≥0.80.
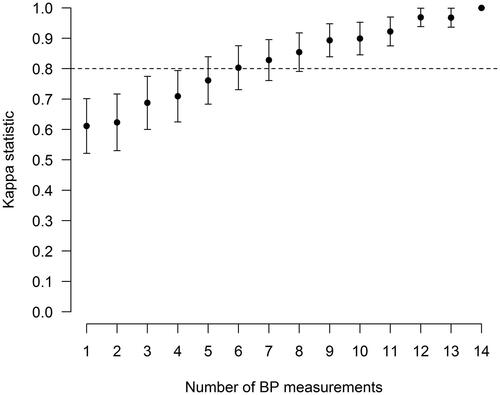
Table 2. Agreement between the increasing number of successive home BP measurements and the current 7-day HBPM protocol for the diagnosis of home hypertension (mean home systolic BP ≥135 mm Hg and/or mean home diastolic BP ≥85 mm Hg).
Supplemental Material
Download MS Word (603.1 KB)Data availability statement
The data that support the findings of this study are available from the corresponding author, WS, upon reasonable request.