
Figures & data
Table 1. Characteristics of apparently treatment-resistant and controlled hypertensive patients.
Figure 1. Distribution of drug adherence categories (%) in apparently treatment-resistant (ATRH, n = 81) vs. controlled (n = 63) hypertensive patients.
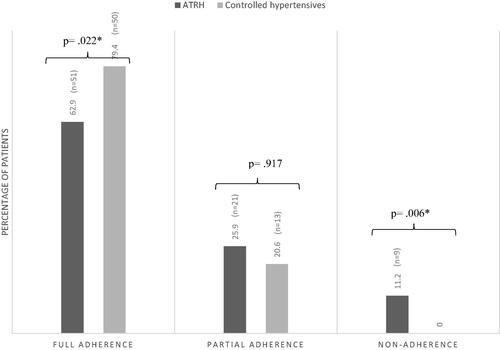
Table 2. Correlations between socio-demographic, health-related and psychological variables and adherence level.
Table 3. Correlation between socio-demographic, health-related and psychological variables and severity of hypertension based on 24-h Ambulatory Systolic BP.
Table 4. Multivariable regression with stepwise backward selection for prediction of adherence level and severity of hypertension in patients with apparently treatment-resistant and controlled hypertension.
Supplemental material